Individual Stocks vs. Index-Matching Investments
In stock market investing, the traditional approach is to buy and sell stocks for individual companies, but this is sometimes risky as it is very difficult to predict when large changes to prices may occur. Large upswings or downswings in stock prices may happen for many reasons. Some positive examples leading to large stock price increases include the following.
-
Retail sales on Amazon have frequently exceeded expectations.1
-
Apple introduced its wildly popular iPhone, and continued to introduce new versions.2
-
Netflix exploded in popularity; a growth of million subscribers in the first quarter of 2018 (up from the expected million) led to a stock increase of in that quarter.3
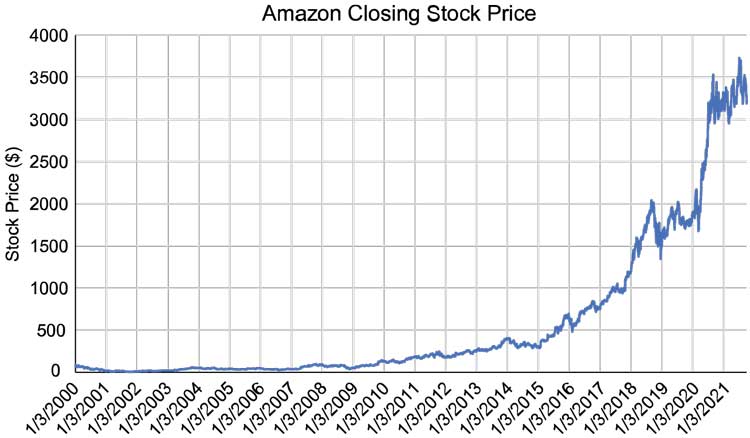
Line graph of the Amazon Closing Stock Price from January 3rd of year 2000 to January 3rd of year 2021. The horizontal axis is labeled in years in increments of 1 year. The vertical axis is labeled Stock Price ($) and ranges from to in increments of . From January 3rd, 2000 to January 3rd, 2015 the line grows slowly and remains below a stock price of . From January 3rd, 2016 to January 3rd, 2021 the line graph shows significant, rapid growth and ends at an approximate stock price of .
Some negative events leading to plummeting stock prices include the following.
-
Microsoft lost a federal antitrust lawsuit in 1999 and its stock price dropped in a single day.4
-
In 2015, the Environmental Protection Agency (EPA) discovered Volkswagen had intentionally programmed certain diesel engines to activate emission controls for certain nitrous oxides only during testing, which made it appear as though the vehicles released less than the legal limit of the polluting gases, but the vehicles actually released times the legal limit! In the wake of the scandal, Volkswagen stock prices dropped from to in just three days.5
As we see, certain events may cause large fluctuations in stock prices, which may be good or bad for the investor, but in either case, it results in a volatile and sometimes risky investment.
Index-matching funds are portfolios (groups of multiple stocks) structured so that they match a market index, such as the Standard & Poor's 500 Index (S&P 500).6 Gains or losses to the investment will be (proportionally) the same as that of the whole S&P 500. Such an index tends to be less volatile than investing in individual stocks, therefore index-matching funds are considered less risky investments. These funds are often used as parts of retirement funds or other long-term investments. But, how true is this assumption? Is an S&P 500 index-matching fund actually a safer investment? Our goal for this project is to test that assumption.
-
Daily closing stock prices can be found on the website https://www.macrotrends.net/stocks/stock-screener. The closing price data for three stocks (Amazon (AMZN), Starbucks (SBUX), and Coca-Cola (KO)), along with the S&P 500 index fund (SPY) from the beginning of 2000 to the end of 2017, can be found on our website.
-
We want to determine how the value of certain stocks and the S&P 500 compare over time, so notice that a new column called Price Change was created measuring the daily change in stock price for each stock, i.e.,
etc.
It does not make sense to simply compare stock prices of the different stocks because the prices are on very different scales. For example, if a stock drops by , it is less consequential than if a stock drops by . A reasonable adjustment is to consider a price change as a percentage of the previous day's price, so the example above would be a drop compared to a drop, which allows us to do a more reasonable comparison. A new column for each stock and the S&P 500 index has been created with these percentages and is labeled as Return.
-
Can you think of any descriptive statistics that would compare the volatility of the returns?
-
Create box plots of the returns for each stock and the S&P 500 index.
-
Do you notice any patterns in the box plots that suggest a difference in the stocks and the S&P 500 index? Explain their practical significance, if any.
-
Delete the outliers in the data for each stock and the S&P 500 index and create histograms for each on the same scale. [Hint. Excel's Data ToolPak add-in allows for easy histograms where we can specify the bins.]
-
Are any differences between the stocks and the S&P 500 index apparent from the histograms? Explain their practical significance, if any.
-
Use a test for goodness of fit to test whether the distributions of the non-outlying stock returns and index returns are different (at least over the range of the S&P 500 returns) at a significance level of .
References
1 https://www.cnbc.com/2017/10/26/amazon-earnings-q3-2017.html
2 https://fortune.com/2016/09/09/apple-stock-iphone-launches/
3 https://www.thestreet.com/investing/netflix-shares-rise-after-beating-estimates-14557098
4 https://www.nytimes.com/2000/04/04/business/us-vs-microsoft-overview-us-judge-says-microsoft-violate