All Chapter Projects


Chapter 1 Project

Welcome to Economics!

Purpose

After finishing your first chapter of economics, you have learned about scarcity and choice and the division of labor. Now, let's explore how these things relate to your everyday life.

The purpose of this exercise is to help you understand both how scarcity affects all of your choices and how the division of labor allows us all to consume more (and, thus, reduces scarcity to some extent).

Directions

This exercise has two parts. In the first, you will keep a journal of choices that you make in a typical day. In the second, you will examine how your choices might be more difficult if we were not able to divide labor and specialize.

Part 1 - Journaling Choices

For a single day, beginning with the moment you wake up in the morning, write down each choice that you have to make. For each choice, identify what some of the other alternatives might be.

For example, when you eat lunch, you are choosing (1) to use your time to consume lunch rather than doing something else, (2) choosing to spend money on lunch (usually) rather than on some other thing, and (3) choosing among the many foods that you could consume.

At the end of the day, examine your choices. Were they good choices, in the sense that if you had to do them again, you would make the same choice? If you did not make the best choices, what kept you from choosing a better alternative?

Summarize your choices in a chart and in a concise essay.

In the coming chapters, you will learn more about scarcity and choice and how your choices affect not only you but society.

Part 2 - Dividing Labor

Go back to your journal and consider one of the meals that you chose to consume. Unless this food came out of your own garden or farm, you purchased this meal or its ingredients. Think about if you had to produce this food from start to finish.

For each component of the food, explain how that part is produced. How many separate parts are involved in your meal? What would happen if you had to produce each of these ingredients yourself? How much time would that take you, and what else would you have to give up?

For example, consider a tuna sandwich. This usually consists of bread, tuna, mayonnaise, and salt, at minimum. To produce this sandwich, you would first need bread. Bread is made from flour, yeast, and other ingredients, so first you would have to grow some wheat. Then you would have to grind the wheat into flour. If you were lucky, you might have a yeast culture saved to help the bread rise. Sugar helps yeast rise, too, so you would need to raise some sugar beets, or possibly keep bees for honey. Then you would have to fish for the tuna, and you would also need some eggs and oil for the mayonnaise, so you would need to have some chickens and an olive tree. Finally, you need salt for all of these things, so you would need to mine the salt (or, if you are near the sea, you can use seawater to obtain salt).

Make a chart of all the parts of your chosen food(s) and estimate how long it would take you to produce this. Write a short description of the process and how this would impact the other things that you typically do. How would your life be different if we were not able to specialize and then exchange goods?

In coming chapters, we will explore the gains from specialization and the benefits of being able to buy and sell goods in markets.
Checklist

Part 1

Part 2


Chapter 2 Project

Choice in a World of Scarcity

Purpose

After finishing this chapter, you have learned more about how scarcity constrains choices for both societies and individuals.

The purpose of this exercise is to help you understand budgets, opportunity costs, comparative advantage, and production possibilities in your own life.

Directions

This exercise has two parts. In the first, you will consider budget choices. In the second, you will consider yourself as a producer of goods and your production possibilities.

Part 1 - Budget and Costs

Consider a week in your life. You could also choose to do this exercise for a day or a month, whichever seems most clear in terms of budgeting.

  1. First, write down how much money you usually have to spend in a week. This is your income. For many students who may not work while in school, that income is fixed by grants, loans, and/or parents/guardians. If you work while in school, your weekly budget may vary based on the number of hours that you work (and of course, you may not receive your paycheck until later), but to keep things simple, just choose an average amount of income that you receive in a normal work week.

  2. Then, consider what you usually choose to buy in a given week. Of course, there are many, many things that you might possibly buy, but again, to keep things simple, choose three major categories, like your favorite foods, entertainment choices, and things you need, like gasoline (if you have a car). What is the average price of each of these goods?

  3. Now, think about your budget constraint. Since we are choosing between more than two goods, we cannot graph a budget constraint as you did in the chapter. But you can still find the endpoints of your constraint, the maximum amount of each good that you could buy if you spent all of your income on that good.

  4. You can also calculate the relative price of each good in terms of other goods. For example, if Good A costs $ 10 , Good B costs $ 5 , and Good C costs $ 1 , for every Good A you buy, you could have purchased 2 units ( 10 / 5 ) of Good B or 10 units ( 10 / 1 ) of Good C. Find these relative prices for all of the combinations of goods that you have.

  5. Then, consider the amount of each good that you typically consume in a week. In a short answer, explain how the relative prices of each good and your budget help to determine your choice. If your budget doubled, how would that change your choices?

In the coming chapters, you will learn about how your tastes and preferences, as well as the prices of goods and income, determine your best choices.

Part 2 - Production Possibilities, Comparative Advantage, and Opportunity Costs

In the first part, you considered income to be fixed. However, you can think of yourself as a producer of "goods," such as income, studying/grades, and recreation.

You have 24 hours a day, or 168 hours in a week, that you can spend on whatever you choose to do. Those choices determine your output of goods. We're going to assume that there are only two things that you can do with your time. Studying/attending class produces grades. Leisure (which could include such things as sleeping and hanging out with friends) produces happiness.

  1. Draw a graph. Label the horizontal axis "Grades" and the vertical axis "Happiness." (Of course, great grades are likely to bring you happiness, too, but we are not going to consider that factor.) What do you think the shape of your production possibilities frontier (PPF) is for these two goods? Are there diminishing returns in the production of these two goods? (Hint: for most people, there are diminishing returns.) How does your graph show you the opportunity cost of grades, and how does that opportunity cost change as you study more and more?

  2. Now, suppose that you have a friend who is much better or much worse at studying than you are. Assume that your friend is just as good at producing happiness as you are. Draw possible PPFs for each of you on a graph. How is the opportunity cost of grades different for each of you for a given amount of happiness production?

  3. Now, explain (a) why your PPFs have the shapes that they have, (b) what you can say about opportunity cost and comparative advantage between you and your friend, and (c) what combination of happiness and grade production you might choose.

  4. Finally, suppose that you have an increase in productive efficiency that makes you better at producing happiness but not at producing grades. Carefully explain how this might affect your PPF, the opportunity cost of grades, and your production choice.

BONUS: Sometimes we waste time, which in this case means that we spend time that produces neither happiness nor better grades. If you waste time, where is your choice relative to the PPF?

Checklist

Part 1

Part 2


Chapter 3 Project

Demand and Supply

Purpose

This chapter taught you about demand, supply, market equilibrium, and social surplus.

The purpose of this exercise is to help you relate demand, supply, and market equilibrium to your own life.

Directions

This exercise has two parts. In the first, you will construct your demand curve for a good and consider your own choices and consumer surplus at different prices. In the second, you will consider how and why your demand for goods might change and how that would impact consumer surplus.

Part 1 - The Demand for Concert Tickets

Suppose that your favorite band or singer plays local shows once a week for the next year.

  1. Consider the lowest ticket price that would make you decide not to go to any shows. For example, if the price is $ 200 , you would not attend a single show. This is the vertical intercept of your demand for concert tickets ( 0 , your maximum price ) .

    The (lowest) price that would make me unwilling to buy any concert tickets is $ (blank) .

  2. Now, consider how many shows you would go to if tickets were free. The maximum number is 52 (the number of weeks in the year). If you chose that, your horizontal intercept would be ( 52 , 0 ) , but you would likely not choose to go every week.

    The greatest number of shows that I would attend if they were free is (blank).

    You have now found two points on your demand curve.

  3. Think about the other points on your demand curve and write your demand schedule. For example, if you were not willing to buy any tickets at $ 200 , you might buy 1 ticket at $ 190 , 2 tickets at $ 150 , etc. Write all the points that you have found in a demand schedule, and then graph your demand curve.

  4. Now, choose a price around the middle of your demand curve and suppose that this is the price of tickets. How many tickets would you buy at this price? Calculate the consumer surplus that you would receive on each of the tickets that you buy at that price, and then add them up to find your total consumer surplus. (For example, if you are willing to pay $ 150 for a ticket, but the ticket price is $ 50 , you receive consumer surplus of $ 100 . Find this for each price and quantity up to the price that you choose.)

  5. Then, suppose that the price drops to the next lowest price on your demand curve. Recalculate consumer surplus for each ticket. How has your total consumer surplus changed?

  6. Finally, with reference to your demand schedule and demand curve, explain the relationship between price and quantity demanded. Then, explain what consumer surplus is and how it changes as the price of tickets changes. What does consumer surplus mean to you? In what sense are you better off when consumer surplus increases?

In the next part, you will relate changes in demand to consumer surplus.

Part 2 - Demand Shifts and Consumer Surplus

For this part of the exercise, you will be using the demand curve that you created in Part 1.

  1. For each of the following cases, determine whether your demand will increase, decrease, or stay the same and briefly explain why. Then, state what will happen to your consumer surplus.

    1. Your income increases, and tickets are a normal good.

    2. You get tired of the band and are less interested in hearing them play.

    3. The price of tickets falls.

    4. The price of tickets for another band that you like a lot falls.

    5. You expect that next year, tickets will be cheaper than they are this year.

  2. Now consider only 1(a). Show the shift of the demand curve, and show graphically what will happen to your consumer surplus. (You do not need to calculate this mathematically.)

  3. Before demand changed, how much consumer surplus did you receive on the last ticket that you bought? How much consumer surplus did you receive on the last ticket after demand changed? What happened to consumer surplus on the first ticket that you bought before and after demand changed?

  4. Finally, carefully explain the two reasons why consumer surplus increases when your demand for a good changes.

Checklist

Part 1

Part 2


Chapter 4 Project

Labor and Financial Markets

Purpose

This chapter taught you about demand and supply in labor and financial markets. All people interact with both markets, usually as suppliers of labor in labor markets and as both suppliers (savers) and demanders (borrowers) of funds in financial markets.

The purpose of this exercise is to help you relate labor and financial markets to your own life.

Directions

This exercise has two parts. In the first, you will construct your own supply curve for labor under changing circumstances. In the second, you will consider your current and future role in financial markets.

Part 1 - Your Supply of Labor

  1. Create a table showing possible wages in the left column and hours of work per week in the right column.

    1. For each of the wages given, fill in the table to show how many hours you would currently be willing to work at each wage. (To make this exercise work, you need to choose some number of hours greater than zero for every wage above $ 0 .)

    2. Then, graph the individual labor supply curve that you have created. Be sure to label each axis!

  2. Now, suppose that the wage is $ 10 . How many hours of labor would you be willing to supply at this wage?

  3. There are 100 people exactly like you in the labor market (including you). Fill out a table and graph the total supply of labor.

  4. How many hours of labor will the total market supply at a wage of $ 10 per hour? How much money will you earn per week? How much will the total labor supply earn per week?

  5. Now, suppose that the government passes a law setting a minimum wage of $ 15 . How many hours of labor would you be willing to supply at this wage? How many hours will the total market supply?

  6. As wages rise, the quantity demanded of labor will fall. Suppose that at the $ 15 minimum wage, firms demand only half of the labor that is supplied at that wage.

    1. If you still have a job, how much will you earn?

    2. Since half of all workers will lose their jobs, what will be the total earnings in the labor market now?

    3. Explain the effect of a minimum wage on (1) workers who still have jobs, (2) workers who are laid off, and (3) the total earnings of all workers.

Part 2 - Exploring Financial Markets

Most college students take out some student loans.

  1. In financial markets, are students the demanders or suppliers of financial capital?

  2. If interest rates rise, are students likely to take out more or fewer student loans?

  3. If the return on a college degree falls, are students likely to take out more or fewer student loans?

  4. Briefly explain the difference between questions (2) and (3) in terms of what has happened in financial markets.

  5. Most young people are borrowers in financial markets because their earnings are relatively low as compared to their future earnings, and they need things like cars and education and houses that they have not had time to save up for. As you get older and your income rises, your income may exceed your spending. Then, you will have savings. At that point in your life, will you be a demander or supplier of financial capital?

  6. If interest rates fall, what will happen to the amount of financial capital that you borrow or save?

  7. During the global financial crisis, the Federal Reserve decreased interest rates to close to zero. One reason why the Fed did this was to encourage firms to borrow funds to expand and to hire more workers. However, this also had an effect on savers.

    Briefly explain how the Fed's actions would affect you if you were a borrower and if you were a saver. Why do you think that the Fed was willing to take this action?

Checklist

Part 1

Part 2


Chapter 5 Project

Elasticity

Purpose

In this chapter, you learned about elasticity and how to calculate the measures of the various types of elasticity. The most important elasticity is the price elasticity of demand, which measures the responsiveness of quantity demanded to changes in price. Generally, demand is more elastic if there are many substitutes available, the good is more of a luxury than a necessity, the good accounts for a large part of a consumer's budget, and the time period involved is longer.

The purpose of this exercise is to illustrate how consumption decisions are affected by the determinants of elasticity, to practice calculating elasticity, and to understand how total spending on a good or service is affected by its elasticity.

Directions

This exercise has two parts. In the first, you will fill in a table and calculate the price elasticity of demand for several goods. In the second, you will evaluate your decisions and categorize the demand for each good as elastic or inelastic.

Part 1 - Complete the Table

Assume that you spend a total of $ 400 per month on the quantities of the goods and services in the following table. Now, suppose that the price of each good and service increases by 50 % , but your budget hasn't changed. You still have only $ 400 to spend on these products.

  1. Complete the table by entering the quantity you would buy after the price increase in the "New Quantity" column. You don't have to spend the entire $ 400 , but you cannot spend more than $ 400 after the price increase.

  2. Calculate the amount you would spend on the good or service after the price increase in the "New Spending" column. Determine the percentage change in the quantity you consume after the price increase in the "%ΔQ" column.

  3. Then, calculate your price elasticity of demand for each good in the "Elasticity" column. Calculate elasticity as the simple | (% change in quantity) / (% change in price) | .

Good Original Price Original Quantity Original Spending New Price New Quantity New Spending Q Elasticity
Apples $ 2 / lb. 5 lbs. $ 10 $ 3 / lb. (blank) (blank) (blank) (blank)
Aspirin $ 2 / bottle 1 $ 2 $ 3 / bottle (blank) (blank) (blank) (blank)
Beer $ 8 / six pack 3 $ 24 $ 12 / six pack (blank) (blank) (blank) (blank)
Print books (Amazon) $ 12 2 $ 24 $ 18 (blank) (blank) (blank) (blank)
Bottled water $ 5 / case 4 $ 20 $ 7.50 / case (blank) (blank) (blank) (blank)
Chicken $ 4 / lb. 4 lbs. $ 16 $ 6 / lb. (blank) (blank) (blank) (blank)
Coffee $ 8 / lb. 3 lbs. $ 24 $ 12 / lb. (blank) (blank) (blank) (blank)
Fast food $ 6 / meal 8 $ 48 $ 9 / meal (blank) (blank) (blank) (blank)
Gasoline $ 2.50 / gallon 24 gallons $ 60 $ 3.75 / gallon (blank) (blank) (blank) (blank)
Laundry detergent $ 5 2 $ 10 $ 7.50 (blank) (blank) (blank) (blank)
Microwave popcorn $ 3 / box 4 $ 12 $ 4.50 / box (blank) (blank) (blank) (blank)
Restaurant meals $ 20 4 $ 80 $ 30 (blank) (blank) (blank) (blank)
Soda $ 5 / case 5 $ 25 $ 7.50 / case (blank) (blank) (blank) (blank)
Uber rides $ 15 3 $ 45 $ 22.50 (blank) (blank) (blank) (blank)

Part 2 - Evaluate and Classify

  1. Based on your calculations, classify the price elasticity for each good as elastic or inelastic.

  2. Explain how the factors that determine elasticity (i.e., availability of substitutes, necessity vs. luxury, and percentage of budget) influenced your response to the 50 % increase in price for each of the goods and services.

  3. Explain the relationship between total spending on a good and a price increase when demand is:

    1. elastic

    2. inelastic

Checklist

Part 1

Part 2


Chapter 6 Project

Consumer Choices

Purpose

At the beginning of the course, we learned that economics is the study of how individuals, businesses, and governments all face the problem of scarcity. Because resources are scarce, these members of the economy must make choices about how to use resources. In this chapter, we focus on how individuals as consumers make choices about how to use their scarce incomes to purchase goods and services.

The purpose of this exercise is to help you understand how rational consumers allocate their scarce incomes to choose which goods and services to purchase based on income, prices of goods and services, and preferences.

Directions

Suppose that the building where all of your classes are held is very far away from the nearest restaurant or school cafeteria. The building has vending machines, so on the two days of the week when you are in class almost all day, you eat at the vending machines. You've budgeted $ 12 per day for food from the machines. Your favorite vending machine purchases are Cokes, bottled water, pretzels, peanut butter crackers (PNBC), and M&Ms. Suppose that initially, Cokes cost $ 1.75 ; bottled water, $ 1.25 ; pretzels, $ 1.00 ; peanut butter crackers, $ 1.25 ; and M&Ms, $ 1.00 .

Part 1 - Calculate Marginal Utility

Create a table for each drink and snack with columns for the marginal utility and marginal utility per dollar if you were to purchase up to five of each. Using your table, estimate the marginal utility of various amounts of each of the drinks and snacks. Then, calculate the marginal utility per dollar for each. Use the marginal utility per dollar to decide how much of each snack to buy.

Now, suppose that the price of Cokes increases to $ 2.25 . Recalculate the marginal utility per dollar for Cokes.

Has the price increase changed your allocation of your $ 12 vending machine budget? Has the quantity of Cokes that you would purchase changed? If so, how?

Now, suppose that the price of Cokes decreases to $ 1.25 . Recalculate the marginal utility per dollar for Cokes.

Has the price decrease changed your allocation of your $ 12 vending machine budget? Has the quantity of Cokes that you would purchase changed? If so, how?

Part 2 - Plot the Demand Curve

Based on your previous answers, plot your demand curve for Cokes on a graph.

Checklist

Part 1

Part 2


Chapter 7 Project

Indifference Curves

Purpose

In this chapter, you have learned how indifference curves can be used to describe consumer behavior in making choices to maximize utility. You have used indifference curves to analyze how consumers respond to changes in income and changes in the prices of goods. You have also applied indifference curves to explain choices between work vs. leisure and present vs. future consumption.

The purposes of this exercise are to use indifference curves to show the impact of a change in the price of a good on a consumer's purchases of that good and to identify the income, substitution, and total effects of a price change. You will also explain choices between work and leisure with indifference curves.

Directions

This exercise has two parts. In the first, you will determine how a change in the price of a product impacts the amount of the product that a consumer will purchase in order to maximize utility; you will also identify the contribution of the substitution and income effects to the consumer's decision. In the second, you will use indifference curve analysis to explain how a person would allocate time between work and leisure when wages change.

Part 1 - Impact of a Price Change on Consumption and Identification of the Contribution of the Substitution and Income Effects to the Total Effect of the Price Change

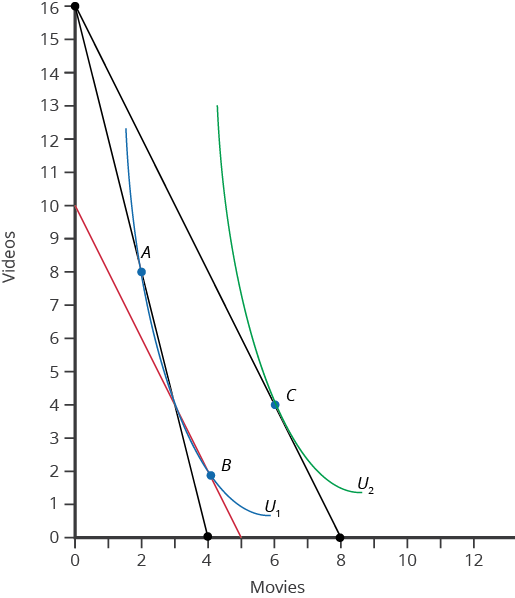
The following graph shows budget constraints and indifference curves for rented videos and movies in a theater for a consumer. The price of going to a movie is originally $ 12 , and the cost to rent a video is $ 3 . At these prices, the consumer maximizes utility on indifference curve U 1 at Point A, renting 8 videos and going to 2 movies.

A graph of budget constraints and indifference curves for rented videos and movies in theaters

The graph has movies on the x-axis and videos on the y-axis. There are three different lines: two black and one red. The first black line crosses the y-axis at 16 and the x-axis at 8 . The second black line crosses the y-axis at 16 and the x-axis at 4 . The red line crosses the y-axis at 10 and the x-axis at 5 . There are two curves that intersect with these lines: U 1 and U 2 . U 1 intersects the second black line at Point A, which is ( 2 , 8 ) , and Point B, which is ( 4 , 2 ) . U 2 intersects the first black line at Point C, which is ( 6 , 4 ) .

  1. How much income does the consumer have?

  2. Suppose that the price of movies decreases from $ 12 to $ 6 , and the consumer moves to a higher indifference curve, U 2 , at Point C, purchasing 6 movies and 4 videos.

    1. The substitution effect due to the price decrease is shown by the move from which points? This move is an increase or decrease of how many movies?

    2. The income effect due to the price decrease is shown by the move from which points? This move is an increase or decrease of how many movies?

    3. The total effect due to the price decrease is shown by the move from which points? This results in an increase or decrease of how many movies?

    4. In order to isolate the substitution effect, how much must be taken away from the consumer?

Part 2 - Allocating Time between Work and Leisure When Wages Change

Suppose that you are considering moving from Alabama to Seattle, Washington. In Alabama, your job as a clothing store clerk pays the minimum wage of $ 7.25 an hour. You are confident that you will be able to find a similar job in Seattle, where the minimum wage is $ 15.75 per hour. Assume that you have 60 hours per week to allocate between work and leisure time.

  1. On a graph, show the budget constraint at $ 7.25 per hour in Alabama and the budget constraint at $ 15.75 per hour in Seattle.

  2. Using indifference curves, show how you would allocate your 60 hours between work and leisure in Alabama and in Seattle.

Checklist

Part 1

Part 2


Chapter 8 Project

Production, Costs, and Industry Structure

Purpose

In this chapter, you have learned the sources of the costs of producing a product. Costs depend on the amount of resources needed to produce the product, shown by the production function, and the costs of those resources, shown by the cost function. You have also learned to identify all costs of production, both explicit and implicit, and use them to make an economic decision.

The purpose of this exercise is to help show you how a firm would look at the inputs of its production and cost functions to make an economic decision.

Directions

This exercise has two parts. In the first, you will begin with a production function for a grocery delivery service and link it to its cost function. In the second, you will identify the explicit and implicit costs of production and find the accounting and economic profit in order to make an economic decision.

Part 1 - Production Function to Cost Function

Suppose Ben is starting a grocery delivery company, which takes grocery orders from customers, goes to the grocery store, buys the groceries, and delivers them to the customers' homes. Employees will receive orders from customers on a cell phone, for which he pays $ 5 per day for service. To make deliveries to customers, he will rent a delivery van, which seats 2 people for $ 75 per day. He plans on hiring between 1 and 6 employees to take the orders, do the grocery shopping, and make the deliveries. He will pay each worker $ 100 in wages per day. Create a table for the different levels of labor and output, leaving room for extra columns, given the following output levels: 1 employee produces 4 units, 2 employees produce 9 units, 3 employees produce 13 units, 4 employees produce 16 units, 5 employees produce 18 units, and 6 employees produce 19 units.

  1. Find the marginal product of labor and enter it into the third column of your table. Where is the point of diminishing returns? Explain the conditions that would lead to diminishing returns for this business.

  2. Identify the fixed and variable costs.

  3. Complete your table by finding variable cost, total cost, marginal cost, average variable cost, and marginal cost for each level of output.

  4. Explain how marginal cost influences average variable and average total cost.

  5. If Ben charges $ 24 per delivery, will he earn a profit? How can you tell?

Part 2 - Finding Economic and Accounting Profit

Suppose Penny, the owner of Penny's Pie Factory, sells 1,000 pies per month for $ 20 per pie. She pays $ 1,600 in wages each month to each of her 2 part-time employees. Butter, flour, sugar, eggs, fruits, chocolate, and other pie ingredients cost her $ 4,000 per month. Her utilities and taxes average $ 600 per month. She owns the kitchen, the mixers, and ovens that the Pie Factory uses, but she could rent them to someone else for $ 1,000 per month if she wasn't using the kitchen and equipment for herself. A large bakery has offered her $ 90,000 per year ( $ 7,500 per month) if she will close her factory and come manage their pie department.

  1. What are Penny's monthly explicit costs?

  2. What are Penny's monthly implicit costs?

  3. Calculate Penny's monthly total revenue.

  4. Calculate Penny's accounting profit per month.

  5. Calculate Penny's economic profit per month.

  6. Suppose that Penny's next best alternative was to close the pie shop and go back to college to finish her chemical engineering degree, and chemical engineers have a starting salary of $ 80,000 per year with potential to grow to $ 120,000 with 10 years of experience. How would this affect Penny's calculations?

Checklist

Part 1

Part 2


Chapter 9 Project

Perfect Competition

Purpose

In this chapter, you learned the characteristics of perfect competition and the advantages of productive and allocative efficiencies that occur in the long run in a perfectly competitive industry. You also determined how perfectly competitive firms make short-run decisions that will maximize profits, minimize losses, or close the business down.

The purpose of this exercise is first, to determine if businesses that you encounter on a daily basis are perfectly competitive, and second, to understand how perfectly competitive business and industries make short-run and long-run decisions.

Directions

This exercise has two parts. In the first, you will examine products that you buy often and determine if they come from a perfectly competitive industry. In the second, you will make short-run and long-run production decisions for a perfectly competitive business.

Part 1 - Identifying Perfect Competition

  1. List ten goods or services that you buy frequently. Are these products from a perfectly competitive industry? Based on the characteristics of perfect competition, why or why not?

Part 2 - Short-Run and Long-Run Production Decisions

Suppose that the following table represents the industry demand and supply for all-day rafting trips down a river in a large state park. Assume that there are 100 firms in this perfectly competitive industry, each with identical costs.

Price Quantity Demanded Quantity Supplied Beginning Quantity Supplied Ending
$ 350 200 600 (blank)
$ 300 300 500 (blank)
$ 250 400 400 (blank)
$ 200 500 300 (blank)
  1. What is the equilibrium price and quantity in the rafting industry?

Each of the 100 firms in the industry has fixed costs of $ 100 a day for equipment, including rafts, helmets, and life jackets. Their variable costs are for the wages of a guide that is needed in each raft and snacks for the rafters. Assume that the following table represents each firm's costs.

Output (trips/day) Variable Cost Total Cost Average Variable Cost Average Total Cost Marginal Cost
0 $ 0 $ 100 (blank) (blank) (blank)
1 $ 200 $ 300 $ 200 $ 300 $ 200
2 $ 360 $ 460 $ 180 $ 230 $ 160
3 $ 500 $ 600 $ 167 $ 200 $ 140
4 $ 750 $ 850 $ 188 $ 213 $ 250
5 $ 1,050 $ 1,150 $ 210 $ 230 $ 300
6 $ 1,400 $ 1,500 $ 233 $ 250 $ 350
  1. Given the market price determined at equilibrium in the industry, explain why each firm in the industry will take four trips per day at a price of $ 250 . How much will each firm profit or lose at this output?

  2. What is the long-run equilibrium price for this industry?

  3. Explain the process through which the industry and each firm in the industry will reach the long-run equilibrium price.

  4. Estimate a reasonable short-run supply curve for the industry to complete the last column of the previous industry demand and supply table.

Checklist

Part 1

Part 2


Chapter 10 Project

Monopoly

Purpose

In this chapter, you have learned the characteristics of monopolies and about barriers that protect monopoly profits by preventing entry of other firms into monopoly markets. You have also learned how a monopoly is inefficient compared to perfect competition.

The purposes of this exercise are to determine if markets that you encounter on a regular basis are monopolies and to identify barriers to entry in those monopoly-based markets to compare monopoly outcomes with those of perfect competition.

Directions

This exercise has two parts. In the first, you'll determine whether some familiar goods and services are monopolies and identify their barriers to entry. In the second, you will contrast the equilibrium price and quantity for a monopoly with that of perfect competition.

Part 1 - Monopolies and Barriers to Entry

Create a table, listing the following goods and services in the first column: electricity, campus bookstore, a required textbook, TikTok, cell phones, and a brand-name drug. Then, in the second column, indicate whether each good or service is likely produced in a monopoly market and whether or not you think this market is a monopoly. If it is, identify the barrier(s) to entry in the third column. Then, list some other goods or services that you frequently purchase and provide the same information.

Part 2 - Comparing Monopoly and Perfect Competition

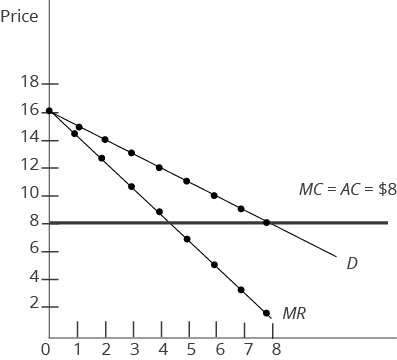
Assume that the following graph represents the demand, marginal revenue, average total cost, and marginal cost for a small business that has been granted a monopoly to provide lunches for visitors to a state park. Additionally, assume that the average and marginal cost of each lunch is $ 8 .

A graph for a small business that has a monopoly

The x-axis is unlabeled, and the y-axis is labeled "Price." There are three lines. The first is a horizontal line at 8 on the y-axis. It is labeled MC = AC = $ 8 . The second line is labeled D. It has the following points: ( 0 , 16 ) , ( 1 , 15 ) , ( 2 , 14 ) , ( 3 , 13 ) , ( 4 , 12 ) , ( 5 , 11 ) , ( 6 , 10 ) , ( 7 , 9 ) , and where is crosses with the horizontal line, ( 8 , 8 ) . The third line is labeled MR. It has the following points: ( 0 , 16 ) , ( 1 , 14 ) , ( 2 , 13 ) , ( 3 , 10 ) , ( 4 , 9 ) , ( 5 , 7 ) , ( 6 , 5 ) , ( 7 , 3 ) , and ( 8 , 2 ) .

Answer the following questions:

  1. To maximize profit, the monopoly will produce (blank) lunches and charge (blank) per lunch.

  2. How did you determine the monopoly's equilibrium price and quantity?

  3. If the firm loses its monopoly and many other firms are allowed to enter the market so that the market becomes perfectly competitive, the output will be (blank) lunches, and the price will be $ (blank) per lunch.

  4. Compared to perfect competition, the output for a monopoly will be (blank) (less, more), and the monopoly price will be (blank) (higher, lower) than the price in perfect competition.

  5. Explain how you determined the perfectly competitive firm's price and output.

  6. Compare monopoly and perfect competition with respect to productive and allocative efficiency.

Checklist

Part 1

Part 2


Chapter 11 Project

Monopolistic Competition and Oligopoly

Purpose

In this chapter, you have learned about imperfectly competitive markets, monopolistic competition, and oligopoly. Monopolistic competition is a market structure which combines elements of both perfect competition and monopoly. Like perfect competition, there are many buyers and sellers in the market. The products in a monopolistically competitive market, unlike those in perfect competition, are differentiated. Like monopoly firms, a firm in monopolistic competition has some control over the price of its product. Oligopoly markets have a few firms producing most of the output, and the firms in the industry are interdependent with respect to decisions concerning price and quantity of output produced.

The purposes of this exercise are to determine if you encounter monopolistically competitive markets and to determine how products are differentiated. You will also discover the interdependence of oligopoly firms.

Directions

This exercise has three parts. In the first, you will explain how products are differentiated in monopolistic competition. In the second, you will explain how a market in monopolistic competition reaches long-run equilibrium and compare the outcome with the outcome in perfect competition with respect to allocative and productive efficiency. In the third, you will make price and output decisions that illustrate interdependence in oligopoly.

Part 1 - Differentiated Products in Monopolistic Competition

  1. Create a table with two columns, one for products and the other for how they are differentiated. In the products column, list the following familiar products: fast food hamburgers, gas stations, bottled water, hotels, blue jeans, and running shoes. Indicate how these familiar products produced in monopolistic competition are differentiated. In the last four rows of your table, list some other products that you buy frequently in monopolistically competitive markets and explain how they are differentiated.

Part 2 - Monopolistic Competition in the Long Run

Suppose that after you graduate, you open a barbecue restaurant in a large city nearby. There are six other barbecue restaurants in town, but you are convinced that you can be successful by differentiating your restaurant and by advertising.

  1. What are some possible ways that you can differentiate your restaurant?

  2. If you and the other six barbecue restaurants earn economic profits, what will happen in the long run?

  3. How does this long-run outcome differ from perfect competition and monopoly?

  4. How could you use advertising to continue to earn economic profits in the long run?

Part 3 - Interdependence in Oligopoly

Suppose that there are only two gas stations, Station X and Station Y, in a small town out in a desert. The nearest gas station is 150 miles away. Currently, each station is selling 2,500 gallons of gas per week and making a profit of $ 12,500 each. The following matrix shows profits for each firm if either or both decide to increase sales to increase profit.

Station X sells 2,500 gallons Station X sells 3,500 gallons
Station Y sells 2,500 gallons Profit for X = $ 12,500
Profit for Y = $ 12,500
Profit for X = $ 14,000
Profit for Y = $ 10,000
Station Y sells 3,500 gallons Profit for X = $ 10,000
Profit for Y = $ 14,000
Profit for X = $ 10,500
Profit for Y = $ 10,500
  1. What is the likely outcome in this market?

  2. Compare the equilibrium price and output of oligopoly with that of perfect competition, monopoly, and monopolistic competition.

  3. As a consumer, which market structure do you prefer? Why?

Checklist

Part 1

Part 2

Part 3


Chapter 12 Project

Monopoly and Antitrust Policy

Purpose

In this chapter, you have learned that business growth, especially through mergers, is associated with both costs and benefits that affect consumers. Let's explore how these things relate to your everyday life.

The purpose of this exercise is to help you understand how consumers are affected by mergers, as well as the considerations of decision makers who must identify whether mergers are beneficial to society.

Directions

This exercise has two parts. In the first, you will consider a merger in an industry that produces a good important to your life. In the second, you will put yourself in the shoes of a decision maker who must approve or block the merger.

Part 1 - How Mergers Affect Consumers

Mergers allow firms to experience growth and realize large-scale production. They also reduce competition. Economists are interested in whether the benefits associated with large-scale production and the resulting loss in competition outweigh the costs, especially in the everyday lives of consumers.

  1. Refer to Table 2 in Lesson 12.1, which lists four U.S. industries and the five largest firms in each. First, choose one U.S. industry that produces a good you consider to be important in your everyday life. Make note of the industry.

  2. Referring to this chapter and the theory of the firm, create a chart to list both the benefits and costs associated with a merger of the five largest firms for your chosen industry and for your own everyday life. Please provide at least five benefits and five costs. You may list more if applicable.

  3. After completing your chart, use its contents to write a paragraph detailing whether you believe a merger in your chosen industry would make you better off as a consumer, worse off as a consumer, or have little to no impact on your life.

    This requires you to think about this theoretical merger in the context of your own everyday life. The best analysis will be specific and demonstrate application to your own experiences as a consumer.

    In Part 1, you concluded whether a merger of the five largest firms in your chosen industry would make you better off as a consumer, worse off as a consumer, or have little to no impact on your life. Policy makers and regulators often have similar considerations but in a more generalized way and for all consumers. This chapter outlined methods and numerical tools used by the FTC and the U.S. Department of Justice to approve or block mergers. When mergers are approved, the government often stipulates forms of regulation. This chapter also identified common forms of regulation used by the government when mergers are approved.

Part 2 - Thinking Like the Decision Maker

  1. Imagine you are asked to make a recommendation to the U.S. government regarding a merger in the industry you chose in Part 1. Write a business memo of professional quality that includes a recommendation on the following:

    1. Which method/numerical tool from the chapter should be used to determine if the merger should be approved or blocked, with justification?

    2. Should the merger be approved, which form of regulation (if any) from this chapter should be a stipulation of the merger, with justification?

To inform your recommendation, consider your analysis in Part 1 and the industry sources in Table 2 from Lesson 12.1. The best recommendations will be confidently stated, with justifications that support economic theory. There is not a single correct analysis; therefore, answers will vary.

Checklist

Part 1

Part 2


Chapter 13 Project

Environmental Protection and Negative Externalities

Purpose

In this chapter, you have learned about externalities that affect third parties that are not directly involved in the supply and demand for a good or service. Negative externalities impose costs on third parties, while positive externalities result in benefits to third parties. Negative externalities may be addressed by command-and-control regulations, market-oriented tools, or better-defined property rights. We have also learned that there is a tradeoff between economic growth and protecting the environment.

The purpose of this exercise is to help you identify some familiar externalities and suggest how they may be addressed, as well as help illustrate the tradeoff between economic growth and environmental protection.

Directions

This exercise has two parts. In the first, you will determine if a negative or positive externality occurs in a transaction. If a negative externality occurs, you will suggest a type of policy to deal with it. In the second, you will demonstrate the tradeoff between economic growth and environmental protection.

Part 1 - Externalities

  1. Create a table with the following situations listed: your neighbor's dog barks all night, everyone in your dorm gets a flu shot, you buy a new iPad, the pollution from the paper mill in your town causes many people to have asthma attacks, and many people text while they are driving.

    1. In a separate column of your table, indicate whether each situation is an externality.

    2. If the situation is an externality, explain in another column whether it is positive or negative.

    3. For negative externalities, which of the three categories of solutions (command-and-control regulation, market-oriented tools, or better-defined property rights) would you suggest to address the negative externality? Enter the type of policy solution in a new column.

    4. In the last three rows of your table, list some negative externalities that you have encountered and suggest a policy solution.

Part 2 - The Tradeoff between Economic Growth and Environmental Protection

Suppose that every summer you help your family with their lobster fishing business in a small town where the only industry is lobster fishing. Due to overfishing and climate change, the lobster population is quickly decreasing. The Environmental Protection Agency is considering using a quota (limiting the number of lobsters that can be caught each summer) or possibly prohibiting lobster fishing for several years.

  1. Explain the tradeoff between environmental protection and economic growth that this situation presents and sketch a production possibilities graph to show it.

  2. Can you think of another situation familiar to you that illustrates the tradeoff between economic growth and environmental protection?

Checklist

Part 1

Part 2


Chapter 14 Project

Positive Externalities and Public Goods

Purpose

In this chapter, you have learned that the existence of positive externalities affects a firm's incentives regarding investments. Let's explore how these things relate to your everyday life.

The purpose of this exercise is to help you understand that market outcomes will be inefficient when positive externalities exist, unless an external force moves the market level of output closer to the socially desirable level.

Directions

This exercise has two parts. In the first, you will consider the economics surrounding the positive externality associated with education. In the second, you will engage in an activity that will illustrate an example of how an external force may help move the market level of output for education to the socially desirable level.

Part 1 - The Economics of Education as a Positive Externality

This chapter described public education as a good with both private and social returns. If there was not an externality present, students would only experience a private return, and the marginal benefits to the student would also fully capture marginal benefits to society. A positive externality, however, creates a gap between marginal benefits to the student and society, which leads to an inefficient level of output in the market for education.

  1. Use the following steps to construct a supply and demand graph that illustrates the market inefficiency caused by a positive externality.

    1. Starting with a blank graph, draw an upward-sloping supply curve and label it MPC (marginal private costs). Assume there are not any social externalities associated with the supply of education.

    2. On the same graph, draw a downward-sloping demand curve and label it MPB (marginal private benefit) to represent the benefits that students experience from education.

    3. Still on the same graph, construct another downward-sloping demand curve that represents MSB (marginal social benefit) for the positive externality case. MSB and MPB should not be equal, the marginal social benefit should be greater because both students and society experience benefits from consumption.

    4. Plot the points where the marginal social benefit and marginal private benefit curves intersect with the marginal private costs curve. What do each of the intersections represent? What does the difference between the two points illustrate?

  2. Using your supply and demand graph, write a paragraph that describes whether competitive markets overproduce or underproduce goods that create positive external benefits. Use the chapter to identify at least three ways in which an efficient outcome can be achieved in the market for education.

Part 2 - Achieving the Socially Desirable Level of Output

In Part 1, you identified at least three ways in which an external force, such as the government, can help move output to the socially desirable level in markets where externalities exist. In the case of education, economists believe that one reason why this inefficiency exists is that decision makers (students) have poor information or are uninformed about the benefits of education. Thus, one way to move market output to the socially desirable level is to find ways for students to receive that information.

  1. As a decision maker in the market for education, first consider the benefits associated with your education. Importantly, focus on the benefits that would incentivize you to make education a priority in your life. Then, construct an 8.5 x 11 in. poster or flyer that educators could display in the hallways of a public high school to encourage students to stay enrolled in school and/or pursue a college degree. Your goal is to deliver information to students in an appealing way that moves the market closer to the socially optimally level in Part 1.

Checklist

Part 1

Part 2


Chapter 15 Project

Labor Markets and Income

Purpose

In this chapter, you have learned how the supply and demand of labor determine the wage rate and how the wage determines how many workers a firm will hire in different market structures. You have also learned that there are many labor markets, one for each type of work, skill level, and location, all of which operate similarly.

The first purpose of this exercise is to illustrate how firms in competitive and imperfectly competitive product markets determine how many people to hire. The second purpose is to research conditions in a market for a specific type of labor.

Directions

This exercise has two parts. In the first, you will determine how many workers a firm in a perfectly competitive product market will hire compared to employment for a firm that sells its product in an imperfectly competitive market. In the second, you will research wages and demand for labor in a specific labor market of your choice.

Part 1 - Determining Employment Levels to Maximize Profit

Suppose that you are planning to open a lawn maintenance business. You have a riding lawn mower and a push mower, an edger, bush trimmer, and some other lawn tools. Since there are many companies in your area offering lawn services, the market for lawn care is perfect competition, and the price is $ 60 per lawn.

You have estimated your production function based on the capital that you have (your lawn equipment) and different numbers of workers that you are considering hiring at the perfectly competitive labor market wage of $ 150 per day. One worker produces an output of 6 lawns per day, 2 workers produce 11 , 3 workers produce 15 , 4 workers produce 18 , and 5 workers produce 20 .

  1. Create a table with the labor and output given and complete your table by finding the marginal product of labor and the value of the marginal product of labor. Based on these calculations, how many people should you hire to maximize profits?

    Now, suppose that the market for lawn care changes to imperfect competition because many of the companies offering lawn services differentiate their product, and the demand curve for lawn care changes. You can charge $ 55 per lawn if your company completes 6 lawns per day, $ 50 if 11 lawns are completed, $ 45 if 15 lawns are completed, $ 40 if 18 lawns are completed, and $ 35 if 20 lawns are completed.

  2. Find the total revenue and the marginal revenue product of labor to complete your table. If the market for workers is still competitive, with a wage of $ 150 per day, how many workers will you hire to maximize profit?

  3. Is the employment rate in an imperfectly competitive product higher or lower than employment in a perfectly competitive product market? Explain.

Part 2 - Researching a Specific Labor Market

  1. Choose an occupation that you are interested in pursuing. Use the following link to find some information about the labor market of that occupation: hawkes.biz/occupationlabormarkets

  2. Find the current number of people employed in this occupation and the median annual wage, both nationally and in your state.

  3. Use the following link to find by how much employment in the occupation will change between 2020 and 2030: hawkes.biz/occupationemployment

  4. Based on this information about the labor market in the occupation, are you satisfied with your choice? Explain how the labor market may change.

Checklist

Part 1

Part 2


Chapter 16 Project

Poverty and Economic Inequality

Purpose

In this chapter, you have learned about poverty, some programs designed to assist people who live in poverty, and income inequality.

The purpose of this exercise is to show what it means to live in poverty and to measure the change in income equality in the United States over time.

Directions

This exercise has two parts. In the first, you will try to budget everyday expenses on the income that defines the poverty level. In the second, you will measure income inequality in the U.S. between 1974 and today.

Part 1 - Budgeting on a Poverty Line Income

In 2022, the poverty line was defined as an income of $ 13,590 or less per year for an individual under the age of 65. In estimating the poverty line, the government assumes that one-third of income will be spent for food.

  1. How much of the $ 13,590 income will be spent for food in a year? In a day? How would you manage to eat on this amount every day?

  2. If your annual income is $ 13,590 , then your monthly income would be approximately $ 1,132 . If you use one-third of your income on food, how would you allocate your monthly income of $ 1,132 between the following categories of expenditures: housing, transportation (car payment, insurance, gas, tires, maintenance), additional expenses (electricity, wireless, TV, water), clothing, school expenses, and other expenses (health insurance, health care, entertainment, debt repayment, donations).

  3. Research and estimate your expected future income when you finish college and begin working full-time in your chosen occupation. How does the poverty budget you completed in #2 compare with the budget you hope to have in the future?

Part 2 - Measuring Income Inequality

The following table uses quintiles to show the distribution of income in the U.S. in 1974 and 2019.

  1. Complete the table by finding the cumulative share of each quintile.

Income Category Share of Income in 1974 (%) Cumulative Share in 1974 (%) Share of Income in 2019 (%) Cumulative Share in 2019 (%)
First quintile 6.2 (blank) 5.1 (blank)
Second quintile 12.0 (blank) 10.2 (blank)
Third quintile 16.7 (blank) 15.2 (blank)
Fourth quintile 23.2 (blank) 22.5 (blank)
Fifth quintile 41.8 (blank) 47.0 (blank)
  1. Using the data you calculated in the table, create a Lorenz curve diagram reflecting the income distributions for 1974 and 2019 on the same graph.

  2. What has happened to income inequality in the forty-five years between 1974 and 2019? What could have caused this change in income inequality?

Checklist

Part 1

Part 2


Chapter 17 Project

Information, Risk, and Insurance

Purpose

In this chapter, you have learned that imperfect and asymmetric information can affect equilibrium prices and quantities in all markets and what can be done to reduce the impact of imperfect information. You have also learned about the problems that imperfect information causes in insurance markets and how insurance companies try to reduce the impact of imperfect information.

The first purpose of this exercise is for you to identify situations where imperfect information is a factor and to suggest ways in which the impact of imperfect information might be decreased. The second purpose is to identify the problems of adverse selection and moral hazard and explain what can be done to reduce their impact.

Directions

This exercise has two parts. In the first, you will identify situations where there is imperfect information, then indicate missing information from both the buyer's and the seller's perspective and suggest ways to increase the information available. In the second, you will determine if a situation is an example of adverse selection or moral hazard and suggest ways that these problems can be reduced.

Part 1 - Imperfect Information

  1. In the following table, for each situation with imperfect information, indicate the information that the buyer and/or the seller are missing and what can be done to increase the information available to either or both sides of the market.

    In the last two rows, list two transactions where you were affected by imperfect information and indicate what you did, or could do in the future, to reduce the impact of imperfect information.

Situation Buyer Seller Ways to Reduce the Imperfect Information Problem
Buying a used car (blank) (blank) (blank)
A doctor recommends knee replacement surgery for you (blank) (blank) (blank)
Booking a hotel for a vacation in Canada (blank) (blank) (blank)
Hiring someone to paint your house (blank) (blank) (blank)
Hiring a lawyer to represent your small business (blank) (blank) (blank)
(blank) (blank) (blank) (blank)

Part 2 - Adverse Selection and Moral Hazard

Indicate if the following situations are an example of adverse selection or moral hazard. Then, suggest a strategy that would reduce the problem.

  1. A university doesn't know if a student that they admit will remain in school, complete their program of study, and graduate.

  2. Most of the people buying health insurance are either sick, elderly, or both.

  3. If health insurance companies must insure everyone at the same low-cost premium, many people pursue careers in bull riding, ski jumping, and race car driving.

  4. Some people respond to credit card offers that promise very low interest rates and encourage balance transfers from other credit cards.

  5. People who have homeowner's insurance don't put new batteries in their smoke alarms.

Checklist

Part 1

Part 2


Chapter 18 Project

Financial Markets

Purpose

After finishing this chapter, you have learned that households have a range of investment choices available to them, including but not limited to bank accounts; investments, like stocks; and tangible assets, like a house. Let's explore how an individual's investment choices relate to everyday life.

The purpose of this exercise is to help you understand that investment options vary with respect to rate of return, risk level, and liquidity. How an individual chooses among these options often changes, especially as they grow older.

Directions

This exercise has two parts. In the first, you will consider how your investment choices may change over the course of your lifetime. In the second, you will consider one specific type of investment and how you can tailor that investment experience to your life.

Part 1 - Investment Choices over Your Lifetime

This chapter divided the mechanisms used by households to save money into three categories:

  • Deposits in bank accounts

  • Investments in bonds, stocks, money market mutual funds, and stock and bond mutual funds

  • Housing and other tangible assets, like gold

Table 3 in Lesson 18.2 elaborated on these categories with more specificity, describing how the rate of return, risk level, and liquidity vary with each.

Assuming that you always desire a high rate of return, let's consider how your risk level and need for liquid assets might be a function of your stage in life by creating a chart. Complete the following tasks for each stage of life: now, fifteen years from now, and forty years from now.

  • Summarize what your life might be like in terms of relevant factors like age, employment, income, debt, financial responsibilities, and life goals.

  • Predict your risk level (high, medium, low) with a brief statement explaining why.

  • Predict your need for liquid assets (high, medium, low) with a brief statement explaining why.

Once your chart is complete, use it in conjunction with Table 3 in Lesson 18.2 to write an essay that identifies your ideal investment choice in each stage of life, justifies each investment choice, and explains why your investment choices are different (or not) in each stage of your life.

Your essay should be at least three paragraphs in length and describe your investment choices in the context of your own everyday life. The best analysis will be specific and demonstrate application to your own experiences.

Part 2 - Tailoring a Stock Choice to Your Life

Table 3 in Lesson 18.2 describes a stock as a high-return investment choice with medium-to-high risk and medium liquidity. In addition to these characteristics, a stock is an investment choice that is unique in how it can be tailored to your life.

Suppose you have the opportunity to purchase a stock and invest in a company. Which stock would you choose? In addition to considering the aforementioned risk level and liquidity, and assuming your goal is high return, you may consider these other factors:

  • Historical performance

  • Trends in the marketplace

  • Companies with strong or particularly interesting business models

  • Sizes of companies

  • Products you use everyday that you think are particularly interesting or might prove to be successful

  • Research/what you see in the news

  • Talking to family and friends

  • Industry and/or company analysis

Compose a one-slide digital presentation to pitch your stock choice. Your goal is to explain your stock choice and convince a hypothetical audience that it was a responsible choice. Note that while it may be tempting to invest in large companies or companies that have historically performed well, it is important to base your investment decision on multiple factors. It is also wise to do your own research before choosing a stock rather than simply relying on the advice of others. You may come across a hidden gem!

Checklist

Part 1

Part 2


Chapter 19 Project

Public Economy

Purpose

After finishing this chapter, you have learned that the advantage of a democratic system of government over other systems is that it allows everyone in a society an equal say. Let's explore how this relates to your everyday life.

The purpose of this exercise is to help you understand a practical difficulty that arises in a democracy when people follow their own self-interest, which is that most people who are eligible to vote choose not to. This is despite the fact that the failure to vote in an election could lead to outcomes that are not favorable to the voter.

Directions

This exercise has two parts. In the first, you will consider which factors play a role in your decision to vote in an upcoming election. In the second, you will use your own experience to incentivize other similar individuals to vote.

Part 1 - What Makes You Vote?

This chapter mentioned various factors that influence an individual's decision to vote. These factors relate to the economic notion that individuals make decisions guided by their own self-interest. The following are some factors:

  • The voter's belief in how likely it is their vote will affect the outcome

  • Cost of the voter acquiring and assimilating information about the policies up for vote

  • Demographics of the voter, such as age, marital status, employment, and income

  • Ease of registering to vote

  • Ease of casting votes, related to such issues as times when the polls are open

  • Involvement of special-interest groups in the election

  • Policies at stake in the election

Also noted in this chapter was the statistic that voter turnout tends to be less than 50 % of eligible voters in local elections and congressional elections when there is no presidential race.

First, review these factors and choose the three that you believe most directly influence your decision to vote in a local election. Then, identify a fourth factor that is not included in the list. Finally, write an essay describing why each of the four factors you selected plays a role in your decision to vote and how the economic notion of self-interest guides your decision.

Your essay should be at least three paragraphs in length and describe the decision to vote in a local election in the context of your own everyday life. The best analysis will be specific and demonstrate application to your experiences as a voter.

Part 2 - Getting Others to Vote

In Part 1, you identified four factors influencing your personal decision to vote in a local election. In Part 2, consider how an external force could use these factors to incentivize you to vote in a local election. Use that consideration to construct an 8.5 × 11 in. poster or flyer that could be distributed to eligible voters similar to yourself to encourage their participation in a local election. Your goal is to improve the aforementioned statistic that less than half of eligible voters participate in local elections. The best flyer demonstrates a clear connection to the four factors you chose in Part 1.

Checklist

Part 1

Part 2


Chapter 20 Project

International Trade

Purpose

After finishing this chapter, you have learned that gains from trade are made when countries specialize in the production of the goods for which they have a comparative advantage. Let's explore how such gains could apply to everyday life.

The purpose of this exercise is to help you understand absolute and comparative advantage and how society benefits from trade based on comparative advantage.

Directions

This exercise has two parts. In the first, you will identify the absolute and comparative advantages of two producers of food and clothing. In the second, you will consider the gains that could emerge from trade between the two producers and how trade benefits society.

Part 1 - Absolute and Comparative Advantage

Consider two nonprofit disaster relief agencies, The Green Triangle and The Pink Heart, that provide food and clothing to disaster areas. Assume that both The Green Triangle and The Pink Heart pursue the same mission of maximizing the provision of food and clothing in disaster areas. Instead of competing, suppose the two organizations agree to behave like countries and specialize in the production of food or clothing, trade with each other in order to obtain units of both food and clothing, and then distribute the units to different disaster areas. The agencies believe that such an agreement will allow for a greater achievement of their similar missions.

The following table shows the possible combinations of food and clothing The Green Triangle agency can provide with a fixed budget per year:

Food (units per year) Clothing (units per year)
60,000 0
40,000 10,000
20,000 20,000
0 30,000

Create a table similar to the previous one, and fill it out for The Pink Heart so that The Green Triangle has an absolute and comparative advantage in the production of food and The Pink Heart has an absolute and comparative advantage in the production of clothing.

Based on the tables for the two agencies, answer the following questions:

  1. What is the opportunity cost of The Green Triangle producing one unit of food (in terms of clothing)?

  2. What is the opportunity cost of The Green Triangle producing one unit of clothing (in terms of food)?

  3. What is the opportunity cost of The Pink Heart producing one unit of food (in terms of clothing)?

  4. What is the opportunity cost of The Pink Heart producing one unit of clothing (in terms of food)?

  5. Explain why The Green Triangle has an absolute and comparative advantage in the production of food.

  6. Explain why The Pink Heart has an absolute and comparative advantage in the production of clothing.

Part 2 - Gains from Trade and Social Benefit

In Part 1, you identified absolute and comparative advantages for two hypothetical relief agencies. Write an essay analyzing the agreement between the relief agencies. Your essay should be at least three paragraphs long and address these questions:

  1. Which relief agency should provide food and why?

  2. Which relief agency should provide clothing and why?

  3. From the economist's perspective, how should society benefit from the agencies' agreement to specialize and trade? How does the outcome of the agreement compare to the alternative of the agencies being self-sufficient?

  4. Does your answer to #3 change if you consider the question from the perspective of an individual living in a disaster area?

Completion of #4 requires you to think about potential gains from this hypothetical agreement between disaster relief agencies in the context of your own everyday life.

Checklist

Part 1

Part 2


Chapter 21 Project

Globalization and Protectionism

Purpose

After finishing this chapter, you have learned that tariffs, tools for restricting the flow of trade, are associated with both costs and benefits that impact entire countries, producers, and consumers. Let's explore how tariffs relate to your everyday life.

The purpose of this exercise is to help you understand the costs and benefits of tariffs, as well as the considerations of decision makers who must identify whether tariffs are beneficial enough to society to implement.

Directions

This exercise has two parts. In the first, you will consider a tariff imposed on a good important to your life. In the second, you will put yourself in the shoes of a decision maker who must decide whether or not to support the tariff.

Part 1 - How Tariffs Affect Countries, Producers, and Consumers

Tariffs are taxes that governments impose on imported goods and services, which in turn make imports more expensive for consumers. Tariffs are also considered a form of protectionism. While protectionism raises the price of the protected good in the domestic market, domestic producers earn more.

On September 24, 2018, President Donald Trump approved a 10 % tariff on goods imported from China. The motivation behind the tariff was to discourage China from carrying out unfair trade practices with the United States. Some of the taxed goods included mandarin oranges, rawhide for pets, hair care products, dog leashes and collars, luggage, handbags, wrapping paper, gas grills, makeup mirrors, vacuum cleaners, toothbrush replacement heads, razors, air conditioners, futons, patio furniture, wooden furniture, and mattresses.

First, choose one of the products listed previously that you consider to be important in your everyday life.

Then, referring to this chapter, complete a chart for your chosen product with at least five benefits and five costs associated with a 10 % tariff on your chosen product. You may list more if applicable.

When identifying costs and benefits, think both big and small and be specific. Consider both international and domestic effects, as well as the impact on both producers and consumers, including yourself.

Completing your chart requires you to think about this tariff in the context of your own everyday life. The best analysis will be specific and demonstrate not only your understanding of the economic consequences of a tariff but also application to your own experiences as a consumer.

Part 2 - Thinking Like the Decision Maker

In Part 1, you identified the costs and benefits associated with a 10 % tariff on a good considered important in your everyday life. Policy makers must often make similar considerations, as well as weigh the associated costs and benefits to determine whether they merit implementation or discontinuation of the policy. This is particularly challenging when a wide range of economic participants are affected and policies have political implications.

For Part 2, imagine you are asked to make a recommendation to the president regarding continuation of the 10 % tariff on the imports from China. Write a business memo of professional quality that includes the following parts:

  • A confident statement recommending that the tariff be continued or discontinued

  • Justification for your recommendation, generalized from the benefits and costs for your chosen product in Part 1

  • A description of the economic participants affected by your recommendation and how they are affected

  • A suggestion for how the United States should alternatively confront China's unfair trade practices should the tariff be discontinued

To inform your recommendation, consider your analysis in Part 1. The best recommendations will be confidently stated, with justifications that are consistent with economic theory. There is not a single correct analysis; therefore, answers will vary.

Checklist

Part 1

Part 2