Indifference Curves
Purpose
In this chapter, you have learned how indifference curves can be used to describe consumer behavior in making choices to maximize utility. You have used indifference curves to analyze how consumers respond to changes in income and changes in the prices of goods. You have also applied indifference curves to explain choices between work vs. leisure and present vs. future consumption.
The purposes of this exercise are to use indifference curves to show the impact of a change in the price of a good on a consumer's purchases of that good and to identify the income, substitution, and total effects of a price change. You will also explain choices between work and leisure with indifference curves.
Directions
This exercise has two parts. In the first, you will determine how a change in the price of a product impacts the amount of the product that a consumer will purchase in order to maximize utility; you will also identify the contribution of the substitution and income effects to the consumer's decision. In the second, you will use indifference curve analysis to explain how a person would allocate time between work and leisure when wages change.
Part 1 - Impact of a Price Change on Consumption and Identification of the Contribution of the Substitution and Income Effects to the Total Effect of the Price Change
The following graph shows budget constraints and indifference curves for rented videos and movies in a theater for a consumer. The price of going to a movie is originally , and the cost to rent a video is . At these prices, the consumer maximizes utility on indifference curve at Point A, renting videos and going to movies.
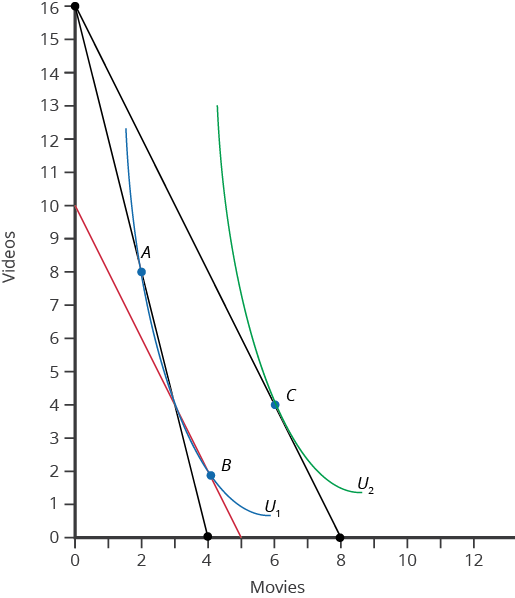
The graph has movies on the x-axis and videos on the y-axis. There are three different lines: two black and one red. The first black line crosses the y-axis at and the x-axis at . The second black line crosses the y-axis at and the x-axis at . The red line crosses the y-axis at and the x-axis at . There are two curves that intersect with these lines: and . intersects the second black line at Point A, which is , and Point B, which is . intersects the first black line at Point C, which is .
-
How much income does the consumer have?
-
Suppose that the price of movies decreases from to , and the consumer moves to a higher indifference curve, , at Point C, purchasing movies and videos.
-
The substitution effect due to the price decrease is shown by the move from which points? This move is an increase or decrease of how many movies?
-
The income effect due to the price decrease is shown by the move from which points? This move is an increase or decrease of how many movies?
-
The total effect due to the price decrease is shown by the move from which points? This results in an increase or decrease of how many movies?
-
In order to isolate the substitution effect, how much must be taken away from the consumer?
-
Part 2 - Allocating Time between Work and Leisure When Wages Change
Suppose that you are considering moving from Alabama to Seattle, Washington. In Alabama, your job as a clothing store clerk pays the minimum wage of an hour. You are confident that you will be able to find a similar job in Seattle, where the minimum wage is per hour. Assume that you have hours per week to allocate between work and leisure time.
-
On a graph, show the budget constraint at per hour in Alabama and the budget constraint at per hour in Seattle.
-
Using indifference curves, show how you would allocate your hours between work and leisure in Alabama and in Seattle.