All Chapter Projects


Chapter 1 Project

Welcome to Economics!

Purpose

After finishing your first chapter of economics, you have learned about scarcity and choice and the division of labor. Now, let's explore how these things relate to your everyday life.

The purpose of this exercise is to help you understand both how scarcity affects all of your choices and how the division of labor allows us all to consume more (and, thus, reduces scarcity to some extent).

Directions

This exercise has two parts. In the first, you will keep a journal of choices that you make in a typical day. In the second, you will examine how your choices might be more difficult if we were not able to divide labor and specialize.

Part 1 - Journaling Choices

For a single day, beginning with the moment you wake up in the morning, write down each choice that you have to make. For each choice, identify what some of the other alternatives might be.

For example, when you eat lunch, you are choosing (1) to use your time to consume lunch rather than doing something else, (2) choosing to spend money on lunch (usually) rather than on some other thing, and (3) choosing among the many foods that you could consume.

At the end of the day, examine your choices. Were they good choices, in the sense that if you had to do them again, you would make the same choice? If you did not make the best choices, what kept you from choosing a better alternative?

Summarize your choices in a chart and in a concise essay.

In the coming chapters, you will learn more about scarcity and choice and how your choices affect not only you but society.

Part 2 - Dividing Labor

Go back to your journal and consider one of the meals that you chose to consume. Unless this food came out of your own garden or farm, you purchased this meal or its ingredients. Think about if you had to produce this food from start to finish.

For each component of the food, explain how that part is produced. How many separate parts are involved in your meal? What would happen if you had to produce each of these ingredients yourself? How much time would that take you, and what else would you have to give up?

For example, consider a tuna sandwich. This usually consists of bread, tuna, mayonnaise, and salt, at minimum. To produce this sandwich, you would first need bread. Bread is made from flour, yeast, and other ingredients, so first you would have to grow some wheat. Then you would have to grind the wheat into flour. If you were lucky, you might have a yeast culture saved to help the bread rise. Sugar helps yeast rise, too, so you would need to raise some sugar beets, or possibly keep bees for honey. Then you would have to fish for the tuna, and you would also need some eggs and oil for the mayonnaise, so you would need to have some chickens and an olive tree. Finally, you need salt for all of these things, so you would need to mine the salt (or, if you are near the sea, you can use seawater to obtain salt).

Make a chart of all the parts of your chosen food(s) and estimate how long it would take you to produce this. Write a short description of the process and how this would impact the other things that you typically do. How would your life be different if we were not able to specialize and then exchange goods?

In coming chapters, we will explore the gains from specialization and the benefits of being able to buy and sell goods in markets.
Checklist

Part 1

Part 2


Chapter 2 Project

Choice in a World of Scarcity

Purpose

After finishing this chapter, you have learned more about how scarcity constrains choices for both societies and individuals.

The purpose of this exercise is to help you understand budgets, opportunity costs, comparative advantage, and production possibilities in your own life.

Directions

This exercise has two parts. In the first, you will consider budget choices. In the second, you will consider yourself as a producer of goods and your production possibilities.

Part 1 - Budget and Costs

Consider a week in your life. You could also choose to do this exercise for a day or a month, whichever seems most clear in terms of budgeting.

  1. First, write down how much money you usually have to spend in a week. This is your income. For many students who may not work while in school, that income is fixed by grants, loans, and/or parents/guardians. If you work while in school, your weekly budget may vary based on the number of hours that you work (and of course, you may not receive your paycheck until later), but to keep things simple, just choose an average amount of income that you receive in a normal work week.

  2. Then, consider what you usually choose to buy in a given week. Of course, there are many, many things that you might possibly buy, but again, to keep things simple, choose three major categories, like your favorite foods, entertainment choices, and things you need, like gasoline (if you have a car). What is the average price of each of these goods?

  3. Now, think about your budget constraint. Since we are choosing between more than two goods, we cannot graph a budget constraint as you did in the chapter. But you can still find the endpoints of your constraint, the maximum amount of each good that you could buy if you spent all of your income on that good.

  4. You can also calculate the relative price of each good in terms of other goods. For example, if Good A costs $ 10 , Good B costs $ 5 , and Good C costs $ 1 , for every Good A you buy, you could have purchased 2 units ( 10 / 5 ) of Good B or 10 units ( 10 / 1 ) of Good C. Find these relative prices for all of the combinations of goods that you have.

  5. Then, consider the amount of each good that you typically consume in a week. In a short answer, explain how the relative prices of each good and your budget help to determine your choice. If your budget doubled, how would that change your choices?

In the coming chapters, you will learn about how your tastes and preferences, as well as the prices of goods and income, determine your best choices.

Part 2 - Production Possibilities, Comparative Advantage, and Opportunity Costs

In the first part, you considered income to be fixed. However, you can think of yourself as a producer of "goods," such as income, studying/grades, and recreation.

You have 24 hours a day, or 168 hours in a week, that you can spend on whatever you choose to do. Those choices determine your output of goods. We're going to assume that there are only two things that you can do with your time. Studying/attending class produces grades. Leisure (which could include such things as sleeping and hanging out with friends) produces happiness.

  1. Draw a graph. Label the horizontal axis "Grades" and the vertical axis "Happiness." (Of course, great grades are likely to bring you happiness, too, but we are not going to consider that factor.) What do you think the shape of your production possibilities frontier (PPF) is for these two goods? Are there diminishing returns in the production of these two goods? (Hint: for most people, there are diminishing returns.) How does your graph show you the opportunity cost of grades, and how does that opportunity cost change as you study more and more?

  2. Now, suppose that you have a friend who is much better or much worse at studying than you are. Assume that your friend is just as good at producing happiness as you are. Draw possible PPFs for each of you on a graph. How is the opportunity cost of grades different for each of you for a given amount of happiness production?

  3. Now, explain (a) why your PPFs have the shapes that they have, (b) what you can say about opportunity cost and comparative advantage between you and your friend, and (c) what combination of happiness and grade production you might choose.

  4. Finally, suppose that you have an increase in productive efficiency that makes you better at producing happiness but not at producing grades. Carefully explain how this might affect your PPF, the opportunity cost of grades, and your production choice.

BONUS: Sometimes we waste time, which in this case means that we spend time that produces neither happiness nor better grades. If you waste time, where is your choice relative to the PPF?

Checklist

Part 1

Part 2


Chapter 3 Project

Demand and Supply

Purpose

This chapter taught you about demand, supply, market equilibrium, and social surplus.

The purpose of this exercise is to help you relate demand, supply, and market equilibrium to your own life.

Directions

This exercise has two parts. In the first, you will construct your demand curve for a good and consider your own choices and consumer surplus at different prices. In the second, you will consider how and why your demand for goods might change and how that would impact consumer surplus.

Part 1 - The Demand for Concert Tickets

Suppose that your favorite band or singer plays local shows once a week for the next year.

  1. Consider the lowest ticket price that would make you decide not to go to any shows. For example, if the price is $ 200 , you would not attend a single show. This is the vertical intercept of your demand for concert tickets ( 0 , your maximum price ) .

    The (lowest) price that would make me unwilling to buy any concert tickets is $ (blank) .

  2. Now, consider how many shows you would go to if tickets were free. The maximum number is 52 (the number of weeks in the year). If you chose that, your horizontal intercept would be ( 52 , 0 ) , but you would likely not choose to go every week.

    The greatest number of shows that I would attend if they were free is (blank).

    You have now found two points on your demand curve.

  3. Think about the other points on your demand curve and write your demand schedule. For example, if you were not willing to buy any tickets at $ 200 , you might buy 1 ticket at $ 190 , 2 tickets at $ 150 , etc. Write all the points that you have found in a demand schedule, and then graph your demand curve.

  4. Now, choose a price around the middle of your demand curve and suppose that this is the price of tickets. How many tickets would you buy at this price? Calculate the consumer surplus that you would receive on each of the tickets that you buy at that price, and then add them up to find your total consumer surplus. (For example, if you are willing to pay $ 150 for a ticket, but the ticket price is $ 50 , you receive consumer surplus of $ 100 . Find this for each price and quantity up to the price that you choose.)

  5. Then, suppose that the price drops to the next lowest price on your demand curve. Recalculate consumer surplus for each ticket. How has your total consumer surplus changed?

  6. Finally, with reference to your demand schedule and demand curve, explain the relationship between price and quantity demanded. Then, explain what consumer surplus is and how it changes as the price of tickets changes. What does consumer surplus mean to you? In what sense are you better off when consumer surplus increases?

In the next part, you will relate changes in demand to consumer surplus.

Part 2 - Demand Shifts and Consumer Surplus

For this part of the exercise, you will be using the demand curve that you created in Part 1.

  1. For each of the following cases, determine whether your demand will increase, decrease, or stay the same and briefly explain why. Then, state what will happen to your consumer surplus.

    1. Your income increases, and tickets are a normal good.

    2. You get tired of the band and are less interested in hearing them play.

    3. The price of tickets falls.

    4. The price of tickets for another band that you like a lot falls.

    5. You expect that next year, tickets will be cheaper than they are this year.

  2. Now consider only 1(a). Show the shift of the demand curve, and show graphically what will happen to your consumer surplus. (You do not need to calculate this mathematically.)

  3. Before demand changed, how much consumer surplus did you receive on the last ticket that you bought? How much consumer surplus did you receive on the last ticket after demand changed? What happened to consumer surplus on the first ticket that you bought before and after demand changed?

  4. Finally, carefully explain the two reasons why consumer surplus increases when your demand for a good changes.

Checklist

Part 1

Part 2


Chapter 4 Project

Labor and Financial Markets

Purpose

This chapter taught you about demand and supply in labor and financial markets. All people interact with both markets, usually as suppliers of labor in labor markets and as both suppliers (savers) and demanders (borrowers) of funds in financial markets.

The purpose of this exercise is to help you relate labor and financial markets to your own life.

Directions

This exercise has two parts. In the first, you will construct your own supply curve for labor under changing circumstances. In the second, you will consider your current and future role in financial markets.

Part 1 - Your Supply of Labor

  1. Create a table showing possible wages in the left column and hours of work per week in the right column.

    1. For each of the wages given, fill in the table to show how many hours you would currently be willing to work at each wage. (To make this exercise work, you need to choose some number of hours greater than zero for every wage above $ 0 .)

    2. Then, graph the individual labor supply curve that you have created. Be sure to label each axis!

  2. Now, suppose that the wage is $ 10 . How many hours of labor would you be willing to supply at this wage?

  3. There are 100 people exactly like you in the labor market (including you). Fill out a table and graph the total supply of labor.

  4. How many hours of labor will the total market supply at a wage of $ 10 per hour? How much money will you earn per week? How much will the total labor supply earn per week?

  5. Now, suppose that the government passes a law setting a minimum wage of $ 15 . How many hours of labor would you be willing to supply at this wage? How many hours will the total market supply?

  6. As wages rise, the quantity demanded of labor will fall. Suppose that at the $ 15 minimum wage, firms demand only half of the labor that is supplied at that wage.

    1. If you still have a job, how much will you earn?

    2. Since half of all workers will lose their jobs, what will be the total earnings in the labor market now?

    3. Explain the effect of a minimum wage on (1) workers who still have jobs, (2) workers who are laid off, and (3) the total earnings of all workers.

Part 2 - Exploring Financial Markets

Most college students take out some student loans.

  1. In financial markets, are students the demanders or suppliers of financial capital?

  2. If interest rates rise, are students likely to take out more or fewer student loans?

  3. If the return on a college degree falls, are students likely to take out more or fewer student loans?

  4. Briefly explain the difference between questions (2) and (3) in terms of what has happened in financial markets.

  5. Most young people are borrowers in financial markets because their earnings are relatively low as compared to their future earnings, and they need things like cars and education and houses that they have not had time to save up for. As you get older and your income rises, your income may exceed your spending. Then, you will have savings. At that point in your life, will you be a demander or supplier of financial capital?

  6. If interest rates fall, what will happen to the amount of financial capital that you borrow or save?

  7. During the global financial crisis, the Federal Reserve decreased interest rates to close to zero. One reason why the Fed did this was to encourage firms to borrow funds to expand and to hire more workers. However, this also had an effect on savers.

    Briefly explain how the Fed's actions would affect you if you were a borrower and if you were a saver. Why do you think that the Fed was willing to take this action?

Checklist

Part 1

Part 2


Chapter 5 Project

Elasticity

Purpose

In this chapter, you learned about elasticity and how to calculate the measures of the various types of elasticity. The most important elasticity is the price elasticity of demand, which measures the responsiveness of quantity demanded to changes in price. Generally, demand is more elastic if there are many substitutes available, the good is more of a luxury than a necessity, the good accounts for a large part of a consumer's budget, and the time period involved is longer.

The purpose of this exercise is to illustrate how consumption decisions are affected by the determinants of elasticity, to practice calculating elasticity, and to understand how total spending on a good or service is affected by its elasticity.

Directions

This exercise has two parts. In the first, you will fill in a table and calculate the price elasticity of demand for several goods. In the second, you will evaluate your decisions and categorize the demand for each good as elastic or inelastic.

Part 1 - Complete the Table

Assume that you spend a total of $ 400 per month on the quantities of the goods and services in the following table. Now, suppose that the price of each good and service increases by 50 % , but your budget hasn't changed. You still have only $ 400 to spend on these products.

  1. Complete the table by entering the quantity you would buy after the price increase in the "New Quantity" column. You don't have to spend the entire $ 400 , but you cannot spend more than $ 400 after the price increase.

  2. Calculate the amount you would spend on the good or service after the price increase in the "New Spending" column. Determine the percentage change in the quantity you consume after the price increase in the "%ΔQ" column.

  3. Then, calculate your price elasticity of demand for each good in the "Elasticity" column. Calculate elasticity as the simple | (% change in quantity) / (% change in price) | .

Good Original Price Original Quantity Original Spending New Price New Quantity New Spending Q Elasticity
Apples $ 2 / lb. 5 lbs. $ 10 $ 3 / lb. (blank) (blank) (blank) (blank)
Aspirin $ 2 / bottle 1 $ 2 $ 3 / bottle (blank) (blank) (blank) (blank)
Beer $ 8 / six pack 3 $ 24 $ 12 / six pack (blank) (blank) (blank) (blank)
Print books (Amazon) $ 12 2 $ 24 $ 18 (blank) (blank) (blank) (blank)
Bottled water $ 5 / case 4 $ 20 $ 7.50 / case (blank) (blank) (blank) (blank)
Chicken $ 4 / lb. 4 lbs. $ 16 $ 6 / lb. (blank) (blank) (blank) (blank)
Coffee $ 8 / lb. 3 lbs. $ 24 $ 12 / lb. (blank) (blank) (blank) (blank)
Fast food $ 6 / meal 8 $ 48 $ 9 / meal (blank) (blank) (blank) (blank)
Gasoline $ 2.50 / gallon 24 gallons $ 60 $ 3.75 / gallon (blank) (blank) (blank) (blank)
Laundry detergent $ 5 2 $ 10 $ 7.50 (blank) (blank) (blank) (blank)
Microwave popcorn $ 3 / box 4 $ 12 $ 4.50 / box (blank) (blank) (blank) (blank)
Restaurant meals $ 20 4 $ 80 $ 30 (blank) (blank) (blank) (blank)
Soda $ 5 / case 5 $ 25 $ 7.50 / case (blank) (blank) (blank) (blank)
Uber rides $ 15 3 $ 45 $ 22.50 (blank) (blank) (blank) (blank)

Part 2 - Evaluate and Classify

  1. Based on your calculations, classify the price elasticity for each good as elastic or inelastic.

  2. Explain how the factors that determine elasticity (i.e., availability of substitutes, necessity vs. luxury, and percentage of budget) influenced your response to the 50 % increase in price for each of the goods and services.

  3. Explain the relationship between total spending on a good and a price increase when demand is:

    1. elastic

    2. inelastic

Checklist

Part 1

Part 2


Chapter 6 Project

Consumer Choices

Purpose

At the beginning of the course, we learned that economics is the study of how individuals, businesses, and governments all face the problem of scarcity. Because resources are scarce, these members of the economy must make choices about how to use resources. In this chapter, we focus on how individuals as consumers make choices about how to use their scarce incomes to purchase goods and services.

The purpose of this exercise is to help you understand how rational consumers allocate their scarce incomes to choose which goods and services to purchase based on income, prices of goods and services, and preferences.

Directions

Suppose that the building where all of your classes are held is very far away from the nearest restaurant or school cafeteria. The building has vending machines, so on the two days of the week when you are in class almost all day, you eat at the vending machines. You've budgeted $ 12 per day for food from the machines. Your favorite vending machine purchases are Cokes, bottled water, pretzels, peanut butter crackers (PNBC), and M&Ms. Suppose that initially, Cokes cost $ 1.75 ; bottled water, $ 1.25 ; pretzels, $ 1.00 ; peanut butter crackers, $ 1.25 ; and M&Ms, $ 1.00 .

Part 1 - Calculate Marginal Utility

Create a table for each drink and snack with columns for the marginal utility and marginal utility per dollar if you were to purchase up to five of each. Using your table, estimate the marginal utility of various amounts of each of the drinks and snacks. Then, calculate the marginal utility per dollar for each. Use the marginal utility per dollar to decide how much of each snack to buy.

Now, suppose that the price of Cokes increases to $ 2.25 . Recalculate the marginal utility per dollar for Cokes.

Has the price increase changed your allocation of your $ 12 vending machine budget? Has the quantity of Cokes that you would purchase changed? If so, how?

Now, suppose that the price of Cokes decreases to $ 1.25 . Recalculate the marginal utility per dollar for Cokes.

Has the price decrease changed your allocation of your $ 12 vending machine budget? Has the quantity of Cokes that you would purchase changed? If so, how?

Part 2 - Plot the Demand Curve

Based on your previous answers, plot your demand curve for Cokes on a graph.

Checklist

Part 1

Part 2


Chapter 7 Project

Indifference Curves

Purpose

In this chapter, you have learned how indifference curves can be used to describe consumer behavior in making choices to maximize utility. You have used indifference curves to analyze how consumers respond to changes in income and changes in the prices of goods. You have also applied indifference curves to explain choices between work vs. leisure and present vs. future consumption.

The purposes of this exercise are to use indifference curves to show the impact of a change in the price of a good on a consumer's purchases of that good and to identify the income, substitution, and total effects of a price change. You will also explain choices between work and leisure with indifference curves.

Directions

This exercise has two parts. In the first, you will determine how a change in the price of a product impacts the amount of the product that a consumer will purchase in order to maximize utility; you will also identify the contribution of the substitution and income effects to the consumer's decision. In the second, you will use indifference curve analysis to explain how a person would allocate time between work and leisure when wages change.

Part 1 - Impact of a Price Change on Consumption and Identification of the Contribution of the Substitution and Income Effects to the Total Effect of the Price Change

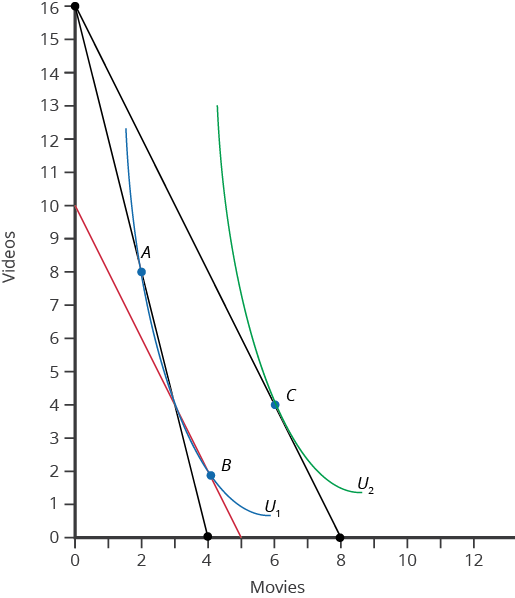
The following graph shows budget constraints and indifference curves for rented videos and movies in a theater for a consumer. The price of going to a movie is originally $ 12 , and the cost to rent a video is $ 3 . At these prices, the consumer maximizes utility on indifference curve U 1 at Point A, renting 8 videos and going to 2 movies.

A graph of budget constraints and indifference curves for rented videos and movies in theaters

The graph has movies on the x-axis and videos on the y-axis. There are three different lines: two black and one red. The first black line crosses the y-axis at 16 and the x-axis at 8 . The second black line crosses the y-axis at 16 and the x-axis at 4 . The red line crosses the y-axis at 10 and the x-axis at 5 . There are two curves that intersect with these lines: U 1 and U 2 . U 1 intersects the second black line at Point A, which is ( 2 , 8 ) , and Point B, which is ( 4 , 2 ) . U 2 intersects the first black line at Point C, which is ( 6 , 4 ) .

  1. How much income does the consumer have?

  2. Suppose that the price of movies decreases from $ 12 to $ 6 , and the consumer moves to a higher indifference curve, U 2 , at Point C, purchasing 6 movies and 4 videos.

    1. The substitution effect due to the price decrease is shown by the move from which points? This move is an increase or decrease of how many movies?

    2. The income effect due to the price decrease is shown by the move from which points? This move is an increase or decrease of how many movies?

    3. The total effect due to the price decrease is shown by the move from which points? This results in an increase or decrease of how many movies?

    4. In order to isolate the substitution effect, how much must be taken away from the consumer?

Part 2 - Allocating Time between Work and Leisure When Wages Change

Suppose that you are considering moving from Alabama to Seattle, Washington. In Alabama, your job as a clothing store clerk pays the minimum wage of $ 7.25 an hour. You are confident that you will be able to find a similar job in Seattle, where the minimum wage is $ 15.75 per hour. Assume that you have 60 hours per week to allocate between work and leisure time.

  1. On a graph, show the budget constraint at $ 7.25 per hour in Alabama and the budget constraint at $ 15.75 per hour in Seattle.

  2. Using indifference curves, show how you would allocate your 60 hours between work and leisure in Alabama and in Seattle.

Checklist

Part 1

Part 2


Chapter 8 Project

Production, Costs, and Industry Structure

Purpose

In this chapter, you have learned the sources of the costs of producing a product. Costs depend on the amount of resources needed to produce the product, shown by the production function, and the costs of those resources, shown by the cost function. You have also learned to identify all costs of production, both explicit and implicit, and use them to make an economic decision.

The purpose of this exercise is to help show you how a firm would look at the inputs of its production and cost functions to make an economic decision.

Directions

This exercise has two parts. In the first, you will begin with a production function for a grocery delivery service and link it to its cost function. In the second, you will identify the explicit and implicit costs of production and find the accounting and economic profit in order to make an economic decision.

Part 1 - Production Function to Cost Function

Suppose Ben is starting a grocery delivery company, which takes grocery orders from customers, goes to the grocery store, buys the groceries, and delivers them to the customers' homes. Employees will receive orders from customers on a cell phone, for which he pays $ 5 per day for service. To make deliveries to customers, he will rent a delivery van, which seats 2 people for $ 75 per day. He plans on hiring between 1 and 6 employees to take the orders, do the grocery shopping, and make the deliveries. He will pay each worker $ 100 in wages per day. Create a table for the different levels of labor and output, leaving room for extra columns, given the following output levels: 1 employee produces 4 units, 2 employees produce 9 units, 3 employees produce 13 units, 4 employees produce 16 units, 5 employees produce 18 units, and 6 employees produce 19 units.

  1. Find the marginal product of labor and enter it into the third column of your table. Where is the point of diminishing returns? Explain the conditions that would lead to diminishing returns for this business.

  2. Identify the fixed and variable costs.

  3. Complete your table by finding variable cost, total cost, marginal cost, average variable cost, and marginal cost for each level of output.

  4. Explain how marginal cost influences average variable and average total cost.

  5. If Ben charges $ 24 per delivery, will he earn a profit? How can you tell?

Part 2 - Finding Economic and Accounting Profit

Suppose Penny, the owner of Penny's Pie Factory, sells 1,000 pies per month for $ 20 per pie. She pays $ 1,600 in wages each month to each of her 2 part-time employees. Butter, flour, sugar, eggs, fruits, chocolate, and other pie ingredients cost her $ 4,000 per month. Her utilities and taxes average $ 600 per month. She owns the kitchen, the mixers, and ovens that the Pie Factory uses, but she could rent them to someone else for $ 1,000 per month if she wasn't using the kitchen and equipment for herself. A large bakery has offered her $ 90,000 per year ( $ 7,500 per month) if she will close her factory and come manage their pie department.

  1. What are Penny's monthly explicit costs?

  2. What are Penny's monthly implicit costs?

  3. Calculate Penny's monthly total revenue.

  4. Calculate Penny's accounting profit per month.

  5. Calculate Penny's economic profit per month.

  6. Suppose that Penny's next best alternative was to close the pie shop and go back to college to finish her chemical engineering degree, and chemical engineers have a starting salary of $ 80,000 per year with potential to grow to $ 120,000 with 10 years of experience. How would this affect Penny's calculations?

Checklist

Part 1

Part 2


Chapter 9 Project

Perfect Competition

Purpose

In this chapter, you learned the characteristics of perfect competition and the advantages of productive and allocative efficiencies that occur in the long run in a perfectly competitive industry. You also determined how perfectly competitive firms make short-run decisions that will maximize profits, minimize losses, or close the business down.

The purpose of this exercise is first, to determine if businesses that you encounter on a daily basis are perfectly competitive, and second, to understand how perfectly competitive business and industries make short-run and long-run decisions.

Directions

This exercise has two parts. In the first, you will examine products that you buy often and determine if they come from a perfectly competitive industry. In the second, you will make short-run and long-run production decisions for a perfectly competitive business.

Part 1 - Identifying Perfect Competition

  1. List ten goods or services that you buy frequently. Are these products from a perfectly competitive industry? Based on the characteristics of perfect competition, why or why not?

Part 2 - Short-Run and Long-Run Production Decisions

Suppose that the following table represents the industry demand and supply for all-day rafting trips down a river in a large state park. Assume that there are 100 firms in this perfectly competitive industry, each with identical costs.

Price Quantity Demanded Quantity Supplied Beginning Quantity Supplied Ending
$ 350 200 600 (blank)
$ 300 300 500 (blank)
$ 250 400 400 (blank)
$ 200 500 300 (blank)
  1. What is the equilibrium price and quantity in the rafting industry?

Each of the 100 firms in the industry has fixed costs of $ 100 a day for equipment, including rafts, helmets, and life jackets. Their variable costs are for the wages of a guide that is needed in each raft and snacks for the rafters. Assume that the following table represents each firm's costs.

Output (trips/day) Variable Cost Total Cost Average Variable Cost Average Total Cost Marginal Cost
0 $ 0 $ 100 (blank) (blank) (blank)
1 $ 200 $ 300 $ 200 $ 300 $ 200
2 $ 360 $ 460 $ 180 $ 230 $ 160
3 $ 500 $ 600 $ 167 $ 200 $ 140
4 $ 750 $ 850 $ 188 $ 213 $ 250
5 $ 1,050 $ 1,150 $ 210 $ 230 $ 300
6 $ 1,400 $ 1,500 $ 233 $ 250 $ 350
  1. Given the market price determined at equilibrium in the industry, explain why each firm in the industry will take four trips per day at a price of $ 250 . How much will each firm profit or lose at this output?

  2. What is the long-run equilibrium price for this industry?

  3. Explain the process through which the industry and each firm in the industry will reach the long-run equilibrium price.

  4. Estimate a reasonable short-run supply curve for the industry to complete the last column of the previous industry demand and supply table.

Checklist

Part 1

Part 2


Chapter 10 Project

Monopoly

Purpose

In this chapter, you have learned the characteristics of monopolies and about barriers that protect monopoly profits by preventing entry of other firms into monopoly markets. You have also learned how a monopoly is inefficient compared to perfect competition.

The purposes of this exercise are to determine if markets that you encounter on a regular basis are monopolies and to identify barriers to entry in those monopoly-based markets to compare monopoly outcomes with those of perfect competition.

Directions

This exercise has two parts. In the first, you'll determine whether some familiar goods and services are monopolies and identify their barriers to entry. In the second, you will contrast the equilibrium price and quantity for a monopoly with that of perfect competition.

Part 1 - Monopolies and Barriers to Entry

Create a table, listing the following goods and services in the first column: electricity, campus bookstore, a required textbook, TikTok, cell phones, and a brand-name drug. Then, in the second column, indicate whether each good or service is likely produced in a monopoly market and whether or not you think this market is a monopoly. If it is, identify the barrier(s) to entry in the third column. Then, list some other goods or services that you frequently purchase and provide the same information.

Part 2 - Comparing Monopoly and Perfect Competition

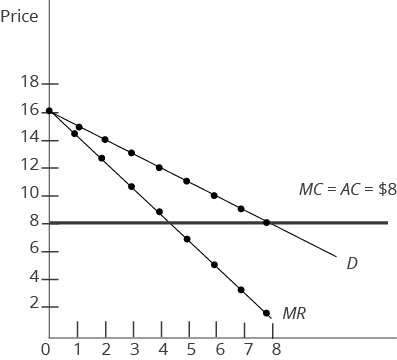
Assume that the following graph represents the demand, marginal revenue, average total cost, and marginal cost for a small business that has been granted a monopoly to provide lunches for visitors to a state park. Additionally, assume that the average and marginal cost of each lunch is $ 8 .

A graph for a small business that has a monopoly

The x-axis is unlabeled, and the y-axis is labeled "Price." There are three lines. The first is a horizontal line at 8 on the y-axis. It is labeled MC = AC = $ 8 . The second line is labeled D. It has the following points: ( 0 , 16 ) , ( 1 , 15 ) , ( 2 , 14 ) , ( 3 , 13 ) , ( 4 , 12 ) , ( 5 , 11 ) , ( 6 , 10 ) , ( 7 , 9 ) , and where is crosses with the horizontal line, ( 8 , 8 ) . The third line is labeled MR. It has the following points: ( 0 , 16 ) , ( 1 , 14 ) , ( 2 , 13 ) , ( 3 , 10 ) , ( 4 , 9 ) , ( 5 , 7 ) , ( 6 , 5 ) , ( 7 , 3 ) , and ( 8 , 2 ) .

Answer the following questions:

  1. To maximize profit, the monopoly will produce (blank) lunches and charge (blank) per lunch.

  2. How did you determine the monopoly's equilibrium price and quantity?

  3. If the firm loses its monopoly and many other firms are allowed to enter the market so that the market becomes perfectly competitive, the output will be (blank) lunches, and the price will be $ (blank) per lunch.

  4. Compared to perfect competition, the output for a monopoly will be (blank) (less, more), and the monopoly price will be (blank) (higher, lower) than the price in perfect competition.

  5. Explain how you determined the perfectly competitive firm's price and output.

  6. Compare monopoly and perfect competition with respect to productive and allocative efficiency.

Checklist

Part 1

Part 2


Chapter 11 Project

Monopolistic Competition and Oligopoly

Purpose

In this chapter, you have learned about imperfectly competitive markets, monopolistic competition, and oligopoly. Monopolistic competition is a market structure which combines elements of both perfect competition and monopoly. Like perfect competition, there are many buyers and sellers in the market. The products in a monopolistically competitive market, unlike those in perfect competition, are differentiated. Like monopoly firms, a firm in monopolistic competition has some control over the price of its product. Oligopoly markets have a few firms producing most of the output, and the firms in the industry are interdependent with respect to decisions concerning price and quantity of output produced.

The purposes of this exercise are to determine if you encounter monopolistically competitive markets and to determine how products are differentiated. You will also discover the interdependence of oligopoly firms.

Directions

This exercise has three parts. In the first, you will explain how products are differentiated in monopolistic competition. In the second, you will explain how a market in monopolistic competition reaches long-run equilibrium and compare the outcome with the outcome in perfect competition with respect to allocative and productive efficiency. In the third, you will make price and output decisions that illustrate interdependence in oligopoly.

Part 1 - Differentiated Products in Monopolistic Competition

  1. Create a table with two columns, one for products and the other for how they are differentiated. In the products column, list the following familiar products: fast food hamburgers, gas stations, bottled water, hotels, blue jeans, and running shoes. Indicate how these familiar products produced in monopolistic competition are differentiated. In the last four rows of your table, list some other products that you buy frequently in monopolistically competitive markets and explain how they are differentiated.

Part 2 - Monopolistic Competition in the Long Run

Suppose that after you graduate, you open a barbecue restaurant in a large city nearby. There are six other barbecue restaurants in town, but you are convinced that you can be successful by differentiating your restaurant and by advertising.

  1. What are some possible ways that you can differentiate your restaurant?

  2. If you and the other six barbecue restaurants earn economic profits, what will happen in the long run?

  3. How does this long-run outcome differ from perfect competition and monopoly?

  4. How could you use advertising to continue to earn economic profits in the long run?

Part 3 - Interdependence in Oligopoly

Suppose that there are only two gas stations, Station X and Station Y, in a small town out in a desert. The nearest gas station is 150 miles away. Currently, each station is selling 2,500 gallons of gas per week and making a profit of $ 12,500 each. The following matrix shows profits for each firm if either or both decide to increase sales to increase profit.

Station X sells 2,500 gallons Station X sells 3,500 gallons
Station Y sells 2,500 gallons Profit for X = $ 12,500
Profit for Y = $ 12,500
Profit for X = $ 14,000
Profit for Y = $ 10,000
Station Y sells 3,500 gallons Profit for X = $ 10,000
Profit for Y = $ 14,000
Profit for X = $ 10,500
Profit for Y = $ 10,500
  1. What is the likely outcome in this market?

  2. Compare the equilibrium price and output of oligopoly with that of perfect competition, monopoly, and monopolistic competition.

  3. As a consumer, which market structure do you prefer? Why?

Checklist

Part 1

Part 2

Part 3


Chapter 12 Project

Monopoly and Antitrust Policy

Purpose

In this chapter, you have learned that business growth, especially through mergers, is associated with both costs and benefits that affect consumers. Let's explore how these things relate to your everyday life.

The purpose of this exercise is to help you understand how consumers are affected by mergers, as well as the considerations of decision makers who must identify whether mergers are beneficial to society.

Directions

This exercise has two parts. In the first, you will consider a merger in an industry that produces a good important to your life. In the second, you will put yourself in the shoes of a decision maker who must approve or block the merger.

Part 1 - How Mergers Affect Consumers

Mergers allow firms to experience growth and realize large-scale production. They also reduce competition. Economists are interested in whether the benefits associated with large-scale production and the resulting loss in competition outweigh the costs, especially in the everyday lives of consumers.

  1. Refer to Table 2 in Lesson 12.1, which lists four U.S. industries and the five largest firms in each. First, choose one U.S. industry that produces a good you consider to be important in your everyday life. Make note of the industry.

  2. Referring to this chapter and the theory of the firm, create a chart to list both the benefits and costs associated with a merger of the five largest firms for your chosen industry and for your own everyday life. Please provide at least five benefits and five costs. You may list more if applicable.

  3. After completing your chart, use its contents to write a paragraph detailing whether you believe a merger in your chosen industry would make you better off as a consumer, worse off as a consumer, or have little to no impact on your life.

    This requires you to think about this theoretical merger in the context of your own everyday life. The best analysis will be specific and demonstrate application to your own experiences as a consumer.

    In Part 1, you concluded whether a merger of the five largest firms in your chosen industry would make you better off as a consumer, worse off as a consumer, or have little to no impact on your life. Policy makers and regulators often have similar considerations but in a more generalized way and for all consumers. This chapter outlined methods and numerical tools used by the FTC and the U.S. Department of Justice to approve or block mergers. When mergers are approved, the government often stipulates forms of regulation. This chapter also identified common forms of regulation used by the government when mergers are approved.

Part 2 - Thinking Like the Decision Maker

  1. Imagine you are asked to make a recommendation to the U.S. government regarding a merger in the industry you chose in Part 1. Write a business memo of professional quality that includes a recommendation on the following:

    1. Which method/numerical tool from the chapter should be used to determine if the merger should be approved or blocked, with justification?

    2. Should the merger be approved, which form of regulation (if any) from this chapter should be a stipulation of the merger, with justification?

To inform your recommendation, consider your analysis in Part 1 and the industry sources in Table 2 from Lesson 12.1. The best recommendations will be confidently stated, with justifications that support economic theory. There is not a single correct analysis; therefore, answers will vary.

Checklist

Part 1

Part 2


Chapter 13 Project

Environmental Protection and Negative Externalities

Purpose

In this chapter, you have learned about externalities that affect third parties that are not directly involved in the supply and demand for a good or service. Negative externalities impose costs on third parties, while positive externalities result in benefits to third parties. Negative externalities may be addressed by command-and-control regulations, market-oriented tools, or better-defined property rights. We have also learned that there is a tradeoff between economic growth and protecting the environment.

The purpose of this exercise is to help you identify some familiar externalities and suggest how they may be addressed, as well as help illustrate the tradeoff between economic growth and environmental protection.

Directions

This exercise has two parts. In the first, you will determine if a negative or positive externality occurs in a transaction. If a negative externality occurs, you will suggest a type of policy to deal with it. In the second, you will demonstrate the tradeoff between economic growth and environmental protection.

Part 1 - Externalities

  1. Create a table with the following situations listed: your neighbor's dog barks all night, everyone in your dorm gets a flu shot, you buy a new iPad, the pollution from the paper mill in your town causes many people to have asthma attacks, and many people text while they are driving.

    1. In a separate column of your table, indicate whether each situation is an externality.

    2. If the situation is an externality, explain in another column whether it is positive or negative.

    3. For negative externalities, which of the three categories of solutions (command-and-control regulation, market-oriented tools, or better-defined property rights) would you suggest to address the negative externality? Enter the type of policy solution in a new column.

    4. In the last three rows of your table, list some negative externalities that you have encountered and suggest a policy solution.

Part 2 - The Tradeoff between Economic Growth and Environmental Protection

Suppose that every summer you help your family with their lobster fishing business in a small town where the only industry is lobster fishing. Due to overfishing and climate change, the lobster population is quickly decreasing. The Environmental Protection Agency is considering using a quota (limiting the number of lobsters that can be caught each summer) or possibly prohibiting lobster fishing for several years.

  1. Explain the tradeoff between environmental protection and economic growth that this situation presents and sketch a production possibilities graph to show it.

  2. Can you think of another situation familiar to you that illustrates the tradeoff between economic growth and environmental protection?

Checklist

Part 1

Part 2


Chapter 14 Project

Positive Externalities and Public Goods

Purpose

In this chapter, you have learned that the existence of positive externalities affects a firm's incentives regarding investments. Let's explore how these things relate to your everyday life.

The purpose of this exercise is to help you understand that market outcomes will be inefficient when positive externalities exist, unless an external force moves the market level of output closer to the socially desirable level.

Directions

This exercise has two parts. In the first, you will consider the economics surrounding the positive externality associated with education. In the second, you will engage in an activity that will illustrate an example of how an external force may help move the market level of output for education to the socially desirable level.

Part 1 - The Economics of Education as a Positive Externality

This chapter described public education as a good with both private and social returns. If there was not an externality present, students would only experience a private return, and the marginal benefits to the student would also fully capture marginal benefits to society. A positive externality, however, creates a gap between marginal benefits to the student and society, which leads to an inefficient level of output in the market for education.

  1. Use the following steps to construct a supply and demand graph that illustrates the market inefficiency caused by a positive externality.

    1. Starting with a blank graph, draw an upward-sloping supply curve and label it MPC (marginal private costs). Assume there are not any social externalities associated with the supply of education.

    2. On the same graph, draw a downward-sloping demand curve and label it MPB (marginal private benefit) to represent the benefits that students experience from education.

    3. Still on the same graph, construct another downward-sloping demand curve that represents MSB (marginal social benefit) for the positive externality case. MSB and MPB should not be equal, the marginal social benefit should be greater because both students and society experience benefits from consumption.

    4. Plot the points where the marginal social benefit and marginal private benefit curves intersect with the marginal private costs curve. What do each of the intersections represent? What does the difference between the two points illustrate?

  2. Using your supply and demand graph, write a paragraph that describes whether competitive markets overproduce or underproduce goods that create positive external benefits. Use the chapter to identify at least three ways in which an efficient outcome can be achieved in the market for education.

Part 2 - Achieving the Socially Desirable Level of Output

In Part 1, you identified at least three ways in which an external force, such as the government, can help move output to the socially desirable level in markets where externalities exist. In the case of education, economists believe that one reason why this inefficiency exists is that decision makers (students) have poor information or are uninformed about the benefits of education. Thus, one way to move market output to the socially desirable level is to find ways for students to receive that information.

  1. As a decision maker in the market for education, first consider the benefits associated with your education. Importantly, focus on the benefits that would incentivize you to make education a priority in your life. Then, construct an 8.5 x 11 in. poster or flyer that educators could display in the hallways of a public high school to encourage students to stay enrolled in school and/or pursue a college degree. Your goal is to deliver information to students in an appealing way that moves the market closer to the socially optimally level in Part 1.

Checklist

Part 1

Part 2


Chapter 15 Project

Labor Markets and Income

Purpose

In this chapter, you have learned how the supply and demand of labor determine the wage rate and how the wage determines how many workers a firm will hire in different market structures. You have also learned that there are many labor markets, one for each type of work, skill level, and location, all of which operate similarly.

The first purpose of this exercise is to illustrate how firms in competitive and imperfectly competitive product markets determine how many people to hire. The second purpose is to research conditions in a market for a specific type of labor.

Directions

This exercise has two parts. In the first, you will determine how many workers a firm in a perfectly competitive product market will hire compared to employment for a firm that sells its product in an imperfectly competitive market. In the second, you will research wages and demand for labor in a specific labor market of your choice.

Part 1 - Determining Employment Levels to Maximize Profit

Suppose that you are planning to open a lawn maintenance business. You have a riding lawn mower and a push mower, an edger, bush trimmer, and some other lawn tools. Since there are many companies in your area offering lawn services, the market for lawn care is perfect competition, and the price is $ 60 per lawn.

You have estimated your production function based on the capital that you have (your lawn equipment) and different numbers of workers that you are considering hiring at the perfectly competitive labor market wage of $ 150 per day. One worker produces an output of 6 lawns per day, 2 workers produce 11 , 3 workers produce 15 , 4 workers produce 18 , and 5 workers produce 20 .

  1. Create a table with the labor and output given and complete your table by finding the marginal product of labor and the value of the marginal product of labor. Based on these calculations, how many people should you hire to maximize profits?

    Now, suppose that the market for lawn care changes to imperfect competition because many of the companies offering lawn services differentiate their product, and the demand curve for lawn care changes. You can charge $ 55 per lawn if your company completes 6 lawns per day, $ 50 if 11 lawns are completed, $ 45 if 15 lawns are completed, $ 40 if 18 lawns are completed, and $ 35 if 20 lawns are completed.

  2. Find the total revenue and the marginal revenue product of labor to complete your table. If the market for workers is still competitive, with a wage of $ 150 per day, how many workers will you hire to maximize profit?

  3. Is the employment rate in an imperfectly competitive product higher or lower than employment in a perfectly competitive product market? Explain.

Part 2 - Researching a Specific Labor Market

  1. Choose an occupation that you are interested in pursuing. Use the following link to find some information about the labor market of that occupation: hawkes.biz/occupationlabormarkets

  2. Find the current number of people employed in this occupation and the median annual wage, both nationally and in your state.

  3. Use the following link to find by how much employment in the occupation will change between 2020 and 2030: hawkes.biz/occupationemployment

  4. Based on this information about the labor market in the occupation, are you satisfied with your choice? Explain how the labor market may change.

Checklist

Part 1

Part 2


Chapter 16 Project

Poverty and Economic Inequality

Purpose

In this chapter, you have learned about poverty, some programs designed to assist people who live in poverty, and income inequality.

The purpose of this exercise is to show what it means to live in poverty and to measure the change in income equality in the United States over time.

Directions

This exercise has two parts. In the first, you will try to budget everyday expenses on the income that defines the poverty level. In the second, you will measure income inequality in the U.S. between 1974 and today.

Part 1 - Budgeting on a Poverty Line Income

In 2022, the poverty line was defined as an income of $ 13,590 or less per year for an individual under the age of 65. In estimating the poverty line, the government assumes that one-third of income will be spent for food.

  1. How much of the $ 13,590 income will be spent for food in a year? In a day? How would you manage to eat on this amount every day?

  2. If your annual income is $ 13,590 , then your monthly income would be approximately $ 1,132 . If you use one-third of your income on food, how would you allocate your monthly income of $ 1,132 between the following categories of expenditures: housing, transportation (car payment, insurance, gas, tires, maintenance), additional expenses (electricity, wireless, TV, water), clothing, school expenses, and other expenses (health insurance, health care, entertainment, debt repayment, donations).

  3. Research and estimate your expected future income when you finish college and begin working full-time in your chosen occupation. How does the poverty budget you completed in #2 compare with the budget you hope to have in the future?

Part 2 - Measuring Income Inequality

The following table uses quintiles to show the distribution of income in the U.S. in 1974 and 2019.

  1. Complete the table by finding the cumulative share of each quintile.

Income Category Share of Income in 1974 (%) Cumulative Share in 1974 (%) Share of Income in 2019 (%) Cumulative Share in 2019 (%)
First quintile 6.2 (blank) 5.1 (blank)
Second quintile 12.0 (blank) 10.2 (blank)
Third quintile 16.7 (blank) 15.2 (blank)
Fourth quintile 23.2 (blank) 22.5 (blank)
Fifth quintile 41.8 (blank) 47.0 (blank)
  1. Using the data you calculated in the table, create a Lorenz curve diagram reflecting the income distributions for 1974 and 2019 on the same graph.

  2. What has happened to income inequality in the forty-five years between 1974 and 2019? What could have caused this change in income inequality?

Checklist

Part 1

Part 2


Chapter 17 Project

Information, Risk, and Insurance

Purpose

In this chapter, you have learned that imperfect and asymmetric information can affect equilibrium prices and quantities in all markets and what can be done to reduce the impact of imperfect information. You have also learned about the problems that imperfect information causes in insurance markets and how insurance companies try to reduce the impact of imperfect information.

The first purpose of this exercise is for you to identify situations where imperfect information is a factor and to suggest ways in which the impact of imperfect information might be decreased. The second purpose is to identify the problems of adverse selection and moral hazard and explain what can be done to reduce their impact.

Directions

This exercise has two parts. In the first, you will identify situations where there is imperfect information, then indicate missing information from both the buyer's and the seller's perspective and suggest ways to increase the information available. In the second, you will determine if a situation is an example of adverse selection or moral hazard and suggest ways that these problems can be reduced.

Part 1 - Imperfect Information

  1. In the following table, for each situation with imperfect information, indicate the information that the buyer and/or the seller are missing and what can be done to increase the information available to either or both sides of the market.

    In the last two rows, list two transactions where you were affected by imperfect information and indicate what you did, or could do in the future, to reduce the impact of imperfect information.

Situation Buyer Seller Ways to Reduce the Imperfect Information Problem
Buying a used car (blank) (blank) (blank)
A doctor recommends knee replacement surgery for you (blank) (blank) (blank)
Booking a hotel for a vacation in Canada (blank) (blank) (blank)
Hiring someone to paint your house (blank) (blank) (blank)
Hiring a lawyer to represent your small business (blank) (blank) (blank)
(blank) (blank) (blank) (blank)

Part 2 - Adverse Selection and Moral Hazard

Indicate if the following situations are an example of adverse selection or moral hazard. Then, suggest a strategy that would reduce the problem.

  1. A university doesn't know if a student that they admit will remain in school, complete their program of study, and graduate.

  2. Most of the people buying health insurance are either sick, elderly, or both.

  3. If health insurance companies must insure everyone at the same low-cost premium, many people pursue careers in bull riding, ski jumping, and race car driving.

  4. Some people respond to credit card offers that promise very low interest rates and encourage balance transfers from other credit cards.

  5. People who have homeowner's insurance don't put new batteries in their smoke alarms.

Checklist

Part 1

Part 2


Chapter 18 Project

Financial Markets

Purpose

After finishing this chapter, you have learned that households have a range of investment choices available to them, including but not limited to bank accounts; investments, like stocks; and tangible assets, like a house. Let's explore how an individual's investment choices relate to everyday life.

The purpose of this exercise is to help you understand that investment options vary with respect to rate of return, risk level, and liquidity. How an individual chooses among these options often changes, especially as they grow older.

Directions

This exercise has two parts. In the first, you will consider how your investment choices may change over the course of your lifetime. In the second, you will consider one specific type of investment and how you can tailor that investment experience to your life.

Part 1 - Investment Choices over Your Lifetime

This chapter divided the mechanisms used by households to save money into three categories:

  • Deposits in bank accounts

  • Investments in bonds, stocks, money market mutual funds, and stock and bond mutual funds

  • Housing and other tangible assets, like gold

Table 3 in Lesson 18.2 elaborated on these categories with more specificity, describing how the rate of return, risk level, and liquidity vary with each.

Assuming that you always desire a high rate of return, let's consider how your risk level and need for liquid assets might be a function of your stage in life by creating a chart. Complete the following tasks for each stage of life: now, fifteen years from now, and forty years from now.

  • Summarize what your life might be like in terms of relevant factors like age, employment, income, debt, financial responsibilities, and life goals.

  • Predict your risk level (high, medium, low) with a brief statement explaining why.

  • Predict your need for liquid assets (high, medium, low) with a brief statement explaining why.

Once your chart is complete, use it in conjunction with Table 3 in Lesson 18.2 to write an essay that identifies your ideal investment choice in each stage of life, justifies each investment choice, and explains why your investment choices are different (or not) in each stage of your life.

Your essay should be at least three paragraphs in length and describe your investment choices in the context of your own everyday life. The best analysis will be specific and demonstrate application to your own experiences.

Part 2 - Tailoring a Stock Choice to Your Life

Table 3 in Lesson 18.2 describes a stock as a high-return investment choice with medium-to-high risk and medium liquidity. In addition to these characteristics, a stock is an investment choice that is unique in how it can be tailored to your life.

Suppose you have the opportunity to purchase a stock and invest in a company. Which stock would you choose? In addition to considering the aforementioned risk level and liquidity, and assuming your goal is high return, you may consider these other factors:

  • Historical performance

  • Trends in the marketplace

  • Companies with strong or particularly interesting business models

  • Sizes of companies

  • Products you use everyday that you think are particularly interesting or might prove to be successful

  • Research/what you see in the news

  • Talking to family and friends

  • Industry and/or company analysis

Compose a one-slide digital presentation to pitch your stock choice. Your goal is to explain your stock choice and convince a hypothetical audience that it was a responsible choice. Note that while it may be tempting to invest in large companies or companies that have historically performed well, it is important to base your investment decision on multiple factors. It is also wise to do your own research before choosing a stock rather than simply relying on the advice of others. You may come across a hidden gem!

Checklist

Part 1

Part 2


Chapter 19 Project

Public Economy

Purpose

After finishing this chapter, you have learned that the advantage of a democratic system of government over other systems is that it allows everyone in a society an equal say. Let's explore how this relates to your everyday life.

The purpose of this exercise is to help you understand a practical difficulty that arises in a democracy when people follow their own self-interest, which is that most people who are eligible to vote choose not to. This is despite the fact that the failure to vote in an election could lead to outcomes that are not favorable to the voter.

Directions

This exercise has two parts. In the first, you will consider which factors play a role in your decision to vote in an upcoming election. In the second, you will use your own experience to incentivize other similar individuals to vote.

Part 1 - What Makes You Vote?

This chapter mentioned various factors that influence an individual's decision to vote. These factors relate to the economic notion that individuals make decisions guided by their own self-interest. The following are some factors:

  • The voter's belief in how likely it is their vote will affect the outcome

  • Cost of the voter acquiring and assimilating information about the policies up for vote

  • Demographics of the voter, such as age, marital status, employment, and income

  • Ease of registering to vote

  • Ease of casting votes, related to such issues as times when the polls are open

  • Involvement of special-interest groups in the election

  • Policies at stake in the election

Also noted in this chapter was the statistic that voter turnout tends to be less than 50 % of eligible voters in local elections and congressional elections when there is no presidential race.

First, review these factors and choose the three that you believe most directly influence your decision to vote in a local election. Then, identify a fourth factor that is not included in the list. Finally, write an essay describing why each of the four factors you selected plays a role in your decision to vote and how the economic notion of self-interest guides your decision.

Your essay should be at least three paragraphs in length and describe the decision to vote in a local election in the context of your own everyday life. The best analysis will be specific and demonstrate application to your experiences as a voter.

Part 2 - Getting Others to Vote

In Part 1, you identified four factors influencing your personal decision to vote in a local election. In Part 2, consider how an external force could use these factors to incentivize you to vote in a local election. Use that consideration to construct an 8.5 × 11 in. poster or flyer that could be distributed to eligible voters similar to yourself to encourage their participation in a local election. Your goal is to improve the aforementioned statistic that less than half of eligible voters participate in local elections. The best flyer demonstrates a clear connection to the four factors you chose in Part 1.

Checklist

Part 1

Part 2


Chapter 20 Project

The Macroeconomic Perspective

Purpose

In this chapter, you have learned about how GDP helps with measuring the size of the economy. When evaluating economic statistics, there is a significant difference between nominal and real measurements, which refer to whether inflation has distorted a given statistic.

It is also common to use GDP as a measure of economic welfare or standard of living. The level of GDP per capita captures some of what we mean by the phrase standard of living, which is a broader term than GDP.

The purpose of this exercise is to illustrate an application of a macroeconomic perspective and understand the building blocks that lead to increased GDP per capita.

Directions

This exercise has two parts. In the first, you will be reflecting on prompts prior to the assignment.

In the second, you will be comparing the United States with another country to understand the building blocks that lead to increased GDP per capita.

Part 1 - Pre-Assignment Reflection

In this chapter, you learned about how GDP is a rough estimate but useful. Even though GDP does not measure the standard of living with any exactness, it does measure production well and signify when a country is materially better or worse off in terms of jobs and incomes.

Answer the following questions using clear, detailed, and complete thoughts. Include at least three sentences per question; one sentence should provide evidence (e.g., from the textbook, notes, etc.) to support your thoughts.

  1. What does "educational attainment" mean to you?

  2. What does "health improvement" mean to you?

  3. Describe two examples of environmental protections used in the U.S. today.

  4. Illustrate an example of increased GDP per capita that you learned in this chapter.

Part 2 - Researching Building Blocks of Increased GDP per Capita

In this chapter, you also learned that there are building blocks, or factors, that lead to increased GDP per capita. GDP per capita is not the most accurate measure of the standard of living, but it does measure production and indicate improvements and growth in the economy that allow an economist to estimate the nation's standard of living.

  1. Choose a country to compare to the U.S. Think of how your chosen country has increased its GDP per capita.

  2. Research and describe specific ways your chosen country improved each factor that can lead to increased GDP per capita.

    • This portion should be a minimum of three sentences for each factor. You must provide evidence from the text, notes, or a credible external source. If you use an external source, remember to cite it.

  3. Compare the improvements in your chosen country to the improvements and economy of the U.S.

If you have trouble, refer to Lesson 20.4 to refresh your understanding of the factors that can lead to increased GDP per capita.

Checklist

Part 1

Part 2


Chapter 21 Project

Economic Growth

Purpose

In this chapter, you have learned how GDP and GDP per capita impact not only standard of living, but also overall modern economic growth. However, a country's economy may need to sacrifice natural resources and the environment to improve standard of living. You have also learned about the recipe for economic growth: labor productivity, human capital and technology, and physical capital.

The purpose of this exercise is to illustrate an application of the economic growth formula and to use visuals to establish an understanding of each concept in the formula.

Directions

This exercise has two parts. In the first, you will demonstrate understanding of the topics covered in this chapter. In the second, you will apply the concepts by creating memes.

Part 1 - Pre-Assignment Reflection

The following questions ask you to recall vital information from this chapter that will help you in the next step of your project. Answer these questions using clear, detailed, and complete thoughts:

  1. How are GDP and GDP per capita related to a country's standard of living?

  2. What can be said about a country that is experiencing decreased labor productivity?

  3. Describe two examples of how a country would decide to sacrifice natural resources and environmental protection to improve standard of living and economic growth.

  4. What is the economic growth formula that you learned from this chapter?

Part 2 - Economic Memes

According to the website Dictionary, a meme is "a humorous image, video, piece of text, etc., that is copied (often with slight variations) and spread rapidly by internet users." You've probably seen, and even circulated, many memes. They flood the internet, our cell phones, and our inboxes.

For this portion of the assignment, you will be creating memes for each component of the economic growth formula: labor productivity, human capital and technology, physical capital, and economic growth.

  1. Develop an image that best represents each of the four components and its effect on economic growth. (Note: the pictures must be original. You may not use pictures available on the internet and/or from other sources.

  2. Use each image as the basis of a meme for each economic concept.

  3. Write one to two paragraphs per meme that explain each picture and how it communicates that particular phase of economic growth. Also, describe a specific instance in which a country has made improvements to that component of the economic growth formula, and explain how it benefited the country's economy.

Examples

Here is an example of a meme explaining elasticity and inelasticity:

A photograph of water running out of a faucet with the words 'It isn't Australian water, but it's still irreplaceable.'

Checklist

Part 1

Part 2


Chapter 22 Project

Unemployment

Purpose

In this chapter, you have learned about how the unemployment rate is calculated, how various individuals in the U.S. population are classified with regard to labor market statistics, and the relationship between unemployment and real GDP. You have also identified the types of unemployment that exist in the economy and reviewed data related to changes in the unemployment rate over the decades.

The purpose of this project is to apply the process used to classify individuals within the labor market and to identify types of unemployment, along with historical changes in the unemployment rate.

Directions

This project has two parts. In the first, you will work on your own to apply the process used by the Bureau of Labor Statistics to provide the unemployment rate. You will also research historical changes in the unemployment rate, making a connection to potential GDP.

In the second, you will work with a classmate to consider the accuracy of the unemployment rate and to make distinctions between the types of unemployment.

Part 1 - Current Population Survey and Changes in Unemployment

Provide at least three examples of a U.S. citizen age 16 or above that would be considered out of the U.S. labor force.

Evaluate the validity of the following statement:

As the United States population continues to grow, it should be expected that the unemployment rate will rise.

To what extent should the U.S. government attempt to completely eliminate frictional unemployment?

Assume that the natural unemployment rate is 5 % . Use FRED data and provide specific years from each of the past five decades when the economy operated at its potential GDP, below its potential GDP, and above its potential GDP (if applicable). Include the unemployment rate for each of the three years selected from each of the five decades.

Part 2 - Debating the Accuracy of the Unemployment Rate and Distinguishing Among the Types of Unemployment

Work with a classmate to complete the following task.

After reading about the process used by the Bureau of Labor Statistics to calculate the unemployment rate, consider potential arguments related to the accuracy of the unemployment rate. One student will defend "Position A" while the other will defend "Position B." When defending the position, the student should explain which classification of employment the position benefits. Each student will then evaluate the validity of the other student's argument. Be sure to share the results with your instructor.

  1. (Student 1) Position A:

    The unemployment rate must be understated each month because:

  2. (Student 2) Evaluation of arguments presented for Position A:

    (Student 2) Position B:

    The unemployment rate must be overstated each month because:

  3. (Student 1) Evaluation of arguments presented for Position B:

Describe several scenarios where a worker becomes frictionally, structurally, and cyclically unemployed. Share your scenarios with a classmate, who will examine their accuracy.

For your classmate's answers, explain why each scenario is accurate or inaccurate. Share each scenario and your feedback with your classmate and instructor. Be sure to include your classmate's name in the submission to your instructor.

Checklist

Part 1

Part 2


Chapter 23 Project

Inflation

Purpose

In this chapter, you have learned how to calculate a price index in order to measure changes in the average price level in the economy. You have used the index to find the rates of inflation across different time periods and distinguish between the core rate of inflation and the rate of inflation for all items. You have also learned to estimate the impact of inflation on purchasing power.

The first purpose of this exercise is to find and use inflation rates to forecast future prices of various goods and services in order to make economic decisions. The second purpose is to determine how much of a price change in goods and services is due to inflation and how much of the price change is due to demand and supply for that specific good or service.

Directions

This exercise has two parts. For both parts, you will use data from the Bureau of Labor Statistics (BLS). In the first, you will find the inflation rate for the previous twelve months and use it to forecast future prices of goods and services in order to make economic decisions. In the second, you will find previous and current prices of items and use the twelve-month inflation rate to identify how much of a price change in a good or service is caused by inflation and how much is due to supply and demand conditions in the market for that specific good or service.

Part 1 - Using Inflation Rates to Make Economic Decisions

To find the data that you need to answer the questions about the following scenarios, go to this webpage.

Using the toolbar, select: Data Tools > Charts and Applications > Charts for Economic News Releases. In the Inflation & Prices section, select Consumer Price Index. From the dropdown, select "12-month percentage change, Consumer Price Index, selected categories (drilldown most recent month)." Then select "Show table" under the graph to see a table with more details.

  1. Anna graduated from college last year and started her first job in marketing where her salary is $ 50,000 per year. Her job reviews have been outstanding, so she plans to ask for a raise next year to at least compensate for inflation.

    1. Using the BLS rate of inflation for the previous twelve-month period for all items, how much should Anna's salary be next year to offset inflation in the last twelve months?

    2. Suppose that Anna's boss suggests using the core rate of inflation over the same period of time to make the adjustment. What salary will her boss suggest, and what should Anna point out about using the core rate of inflation to adjust her salary?

  2. Ricardo has just completed his sophomore year in college. He is planning on taking a trip to London to celebrate his college graduation in two years. The cheapest airfare that he can currently find from Atlanta to London is $ 1,200 . Assuming the price of the ticket continues to be affected by inflation, how much will the ticket cost in two years using the BLS rate of inflation for:

    1. Airline fare

    2. All items

    3. The core (all items except food and energy)

    4. Which of the inflation rates would be the best one for Ricardo to use in estimating the future price of his ticket? Why?

  3. Emil is currently driving an old car with a Kelly Blue Book value of $ 10,000 . In a year, he plans on trading it in for a new car that costs $ 36,000 . Use the BLS inflation rates for the last twelve months for used and new vehicles to estimate the cost of the new car and the value of Emil's old car when he trades it in. Assume his car does not depreciate in value.

    1. Assuming the inflation rates for the next twelve months are the same as for the previous twelve months, how much will Emil owe after the trade?

    2. If Emil could trade cars today, how much would he owe?

Part 2 - Price Changes Due to Inflation versus Price Changes Due to Demand and Supply Conditions in a Specific Market

To find the data that you need to answer the questions about the following scenarios, go to this webpage.

Using the toolbar, select: Data Tools > Data Retrieval Tools > Top Picks. In the Inflation & Prices table, navigate to the database named "Average Price Data" and select "Top Picks."

Select the goods in the following table to get the most recent price and the price twelve months ago.

  1. Use the twelve-month inflation rate for the same time period to calculate the real price of the good (the price adjusted for inflation). Then determine how much of the total price change is due to supply and demand conditions for the good and how much is due to inflation.

Item Previous Price Current Price Real Price Price Change Due to Demand and Supply Price Change Due to Inflation
Bacon ( 1 lb. ) (blank) (blank) (blank) (blank) (blank)
Bread ( 1 lb. ) (blank) (blank) (blank) (blank) (blank)
Chicken ( 1 lb. ) (blank) (blank) (blank) (blank) (blank)
Coffee ( 1 lb. ) (blank) (blank) (blank) (blank) (blank)
Milk ( 1 gal ) (blank) (blank) (blank) (blank) (blank)
Oranges ( 1 lb. ) (blank) (blank) (blank) (blank) (blank)
Electricity ( 1 kwh ) (blank) (blank) (blank) (blank) (blank)
Regular Gas ( 1 gal ) (blank) (blank) (blank) (blank) (blank)
  1. Choose one item and research demand and supply conditions in that market to explain the change in its price that is not due to inflation.

Checklist

Part 1

Part 2


Chapter 24 Project

The International Trade and Capital Flows

Purpose

In this chapter, you have learned how to measure a merchandise trade balance and current account balance for a nation. You have also reviewed the pros and cons of a trade deficit and a trade surplus while learning the distinction between the level of trade and the balance of trade.

The purpose of this project is to practice calculating a current account balance between trading partners and to research information provided by the International Trade Commission and the United States Census Bureau related to U.S. trade.

Directions

This project has three parts. In the first, you will examine trade between two households and apply balance of trade calculations to determine the current account balance for one household.

In the second, you will investigate misconceptions related to the dangers of a trade deficit, explaining some pros of a trade deficit.

In the third, you will research data related to the trade of specific states and trade between the United States and its largest trading partners.

Part 1 - Calculating a Current Account Balance

The Johnsons and the Normans are neighbors and often engage in trade. Last month, Tyrone Norman cut the Johnsons' grass and provided other landscaping services, earning $ 200 . Melinda Johnson provided a therapeutic massage to both Ronelle and Earl Norman, earning $ 130 . Chris Johnson sold Earl Norman a set of custom-made family monogramed cornhole boards for $ 250 . Ronelle Norman sold Melinda Johnson her low-carb diet cookbook for $ 20 . Kasey Johnson sent $ 20 in a "Congratulations" card to Tyrone Norman for graduating from high school. Chris Johnson paid $ 75 to Earl Norman as an interest payment on Earl's investment in the rental condo that Chris Johnson built on the Johnson property.

Calculate the current account balance for the Normans by completing the following chart:

Price Exports (in $) Imports (in $) Balance
Goods (blank) (blank) (blank)
Services (blank) (blank) (blank)
Income receipts and payments (blank) (blank) (blank)
Unilateral transfers (blank) (blank) (blank)
Current account balance (blank) (blank) (blank)

Part 2 - Assessing the Public Perception Associated with Trade Deficits

It is a common myth that eliminating the trade deficit should be a priority for the United States. To validate that this is an economic misconception, please poll at least ten people. Try to survey classmates outside of economics class or even friends and family. To quickly share and manage your survey, you can use Poll Maker or a similar free survey management application. Share your survey link with others via text, email, or social media.

Present the following question in your poll:

  • Should the United States government prioritize eliminating the U.S. trade deficit?

    • Yes or No

Summarize and share your survey results with your instructor, explaining two important reasons why opposition to a trade deficit can involve flawed economic logic.

Part 3 - Using International Trade Data from the United States Census Bureau

Use this webpage to research trade data from the International Trade Administration.

  1. Determine the top two most exported commodity sectors from the following states:

    • Alaska

    • Nevada

    • New York

    • South Carolina

    • Texas

  2. What is the most imported commodity sector of your home state? Be sure to include your home state and the sector.

Use this webpage to explore data from the U.S. Census Bureau. In order to find the most accurate and recent data, select a nation's name to view the trade figures for each month. Use the data provided to answer the following questions.

  1. Provide two nations that the United States had a trade surplus with during the most recent month. Be sure to provide the nation, month, and balance of trade.

  2. Determine the largest three trading partners for the United States in the most recent month. Starting with the largest, provide the percentage of total U.S. trade represented by each nation.

The U.S. Census Bureau uses end-use codes to classify exported and imported merchandise based on the principal use of the good or service. This webpage has a link to download an Excel file containing the values of U.S. exports to other countries from 2012 to present.

  1. For each of the largest trading partners you listed in Question 4, list the top two exports from the U.S. For each export, list the end-use code and the value (in thousands of dollars). Be sure to use the data from the most recent year listed.

  2. For each of the largest trading partners you listed in Question 4, list the top two imports to the U.S. For each import, list the end-use code and the value (in thousands of dollars). Be sure to use the data from the most recent year listed.

Now, visit this webpage.

  1. For each of the largest trading partners you listed in Question 4, list the balance of trade (in millions of dollars). Be sure to use the data from the most recent year listed.

  2. During the research you just conducted, did any data surprise you? Were any of your findings consistent with your expectations related to U.S. trade?

Checklist

Part 1

Part 2

Part 3


Chapter 25 Project

The Aggregate Demand/Aggregate Supply Model

Purpose

In this chapter, you have learned how the aggregate demand/aggregate supply (AD/AS) model is constructed. The AD/AS model demonstrates how the price level and gross domestic product (GDP) are determined and how fiscal policy (changes in taxes and government spending) can be employed to influence macroeconomic outcomes.

The purpose of this project is to analyze the economic effects of recent recessions and the U.S. government's responses to them.

Directions

This project has three parts. In the first, you will evaluate how consumption and investment were affected during the Great Recession and how the drop in these two variables combined to reduce AD.

In the second, you will summarize the final impact such changes had on the following macroeconomic variables and indicators: real GDP, changes in the price level (i.e., the inflation rate), the unemployment rate, and the consumer and business confidence indices.

In the third, you will analyze the macroeconomic impacts of the CARES Act and how this compared to the governmental policies enacted during the Great Recession.

Part 1 - Evaluating the Macroeconomic Conditions of the Great Recession and the COVID-19 Recession

The Great Recession was the economic downturn in the U.S. from 2007 to 2009 that occurred as the result of a burst housing bubble and financial crisis, and the COVID-19 recession was the brief yet sharp economic downturn in 2020 resulting from the COVID-19 pandemic. The following links provide a graphic representation of the trends of different components in the U.S. economy. Pay attention to the data for years leading up to and during both recessions.

  1. Real personal consumer expenditures

    At this webpage, examine the trends in real personal consumption expenditures from 2006 to 2022. Set the dates of observation as 2006 to 2022.

  2. Consumer confidence in the U.S.

    At this webpage, examine the trends in consumer confidence in the U.S. from 2006 to 2022. Set the dates of observation as 2006 to 2022.

  3. Real gross private domestic investment

    At this webpage, examine the trends in real gross private domestic investment from 2006 to 2022. Set the dates of observation as 2006 to 2022.

  4. U.S. business confidence vs. global average

    At this webpage, examine the comparison of business confidence in the U.S. versus the global average. Set the dates of observation as 2006 to 2022.

  5. Inflation rate

    At this webpage, examine the inflation rate for consumer prices in the U.S. Set the dates of observation as 2006 to 2022.

After you review all the data, explain the dramatic changes that occurred in each of these variables in the year preceding the Great Recession (2006), during the Great Recession, and in the years of recovery immediately following the Great Recession (2010–2016). Do the same for the year preceding the COVID-19 recession (2019), during the COVID-19 recession (2020), and the years after the COVID-19 recession (2021–2022). Is this consistent with the idea that negative information/economic conditions feed on themselves and make the situation worse?

If so, how? Be specific in your explanation. Be sure to support your explanation with evidence from each of the economic indices.

Part 2 - How the U.S. Government Used Fiscal Policy to Combat the Great Recession

The Obama administration developed the American Recovery and Reinvestment Act of 2009 (ARRA) in response to the Great Recession. The following two articles describe the goals and the effect of the stimulus package: (hawkes.biz/ARRA1) and (hawkes.biz/ARRA2).

Using evidence from the articles, explain and assess the effectiveness of the fiscal policy measures undertaken by the Obama administration during (and in the immediate years following) the Great Recession.

Second, within the context of the AD/AS diagram, demonstrate the impact of the aforementioned policies on AD and the resulting changes in the price level (that is, the inflation rate) and GDP. (Note: Use Figure 5 in Lesson 25.1 as your starting point for the graphing portion of this exercise. Recall that expansionary fiscal policy would cause the AD curve to shift right, demonstrating an increase.)

Part 3 - Evaluate How the U.S. Government Used Fiscal Policy to Respond to the COVID-19 Recession

The Trump administration developed the Coronavirus Aid, Relief, and Economic Security (CARES) Act in response to the economic turmoil resulting from the 2020 COVID-19 pandemic. The scope of this act was staggering, distributing over $ 2 trillion of federal funds to families and firms across the United States. The following two articles discuss the macroeconomic impact on the country: (hawkes.biz/CARES1) and (hawkes.biz/CARES2).

Using evidence from the articles, discuss the short- and long-term effects of the CARES Act on both unemployment and GDP.

Explain how changes in aggregate demand or aggregate supply incited the government to pass the CARES Act.

Next, explain how changes in aggregate supply and aggregate demand were different during the COVID-19 recession than they were preceding the American Recovery and Reinvestment Act of 2009.

Checklist

Part 1

Part 2

Part 3


Chapter 26 Project

The Keynesian Perspective

Purpose

In this chapter, you have learned the determinants of aggregate demand. You have also learned how macroeconomic equilibrium changes due to shifts in aggregate demand, including the multiplier effect of spending changes. You have studied how the perceived relationship between unemployment and inflation can be evaluated, and you have also learned the zones along the aggregate supply curve.

The purpose of this project is to identify specific changes in aggregate demand components and make distinctions between zones of the real-world aggregate supply curve. You will also apply the Phillips curve to aggregate data and changes to factor prices.

Directions

This project has three parts. In the first, you will work on your own and then with a classmate to apply the concepts of aggregate demand components to real economic events.

In the second, you will identify the zone of the aggregate supply curve where macroeconomic equilibrium occurs.

In the third, you will apply the Phillips curve individually and then with a classmate.

Part 1 - Aggregate Demand in the News

Review the following articles:

  1. "Congressional Budget Office: Budget Deficit Grows $39B in First Quarter"

  2. "Consumer Index Sinks to All-Time Low"

  3. "U.S. Firms Pull Back on Investment"

  4. "China's Economic Slowdown"

Explain how each event would affect aggregate demand in the U.S. economy. Be sure to include the component of aggregate demand that contributes to the overall shift.

For each component of AD, research and provide an article headline and link. Also, explain the direction that AD will shift.

  • Consumption expenditure

  • Investment expenditure

  • Government spending

  • Spending on net exports (exports minus imports)

Exchange your list with another classmate. Check your classmate's work for accuracy and answer the following questions for each link. Provide your classmate's headlines, article links, aggregate demand applications, and your feedback. Remember to include the name of the classmate that you exchanged headlines with.

  • Did each article relate to the component of aggregate demand that your classmate chose? Explain why or why not.

  • Did your classmate correctly determine how aggregate demand would shift? Explain why or why not.

Part 2 - Determining Aggregate Supply Zone

For the following headlines, assume that the average annual economic growth rate is 3 % , and the normal annual inflation rate is 2 % . Indicate and explain which zone of the real-world aggregate supply curve would best apply. Also, describe the slope of the real-world aggregate supply curve zone.

Headline 1

The annualized economic growth rate has slipped to 5 % , while the annual inflation rate is 1 % . Aggregate demand continues to decline.

Headline 2

The annualized economic growth rate is 1.5 % , while the annual inflation rate has increased to 6 % . Aggregate demand in the economy continues to rise.

Headline 3

The annualized economic growth rate is 3 % , while the annual inflation rate is 2 % . The unemployment rate is consistent with the natural rate of unemployment.

Part 3 - Applying the Phillips Curve

Review the following hypothetical unemployment rates, considering 4 % unemployment to be the level of full employment. Assuming a normal and expected inflation rate of 2 % annually, fill in hypothetical inflation rates that would be consistent with the Phillips curve.

Year Unemployment Rate Inflation Rate
2035 8 % (blank)
2036 6 % (blank)
2037 4 % (blank)
2038 2.5 % (blank)

Review this data provided by Macrotrends LLC on the trend of U.S. crude oil production over the past ten years. Assuming ceteris paribus, would this trend lead to a stronger inverse relationship between unemployment and inflation, as indicated by the Phillips curve?

Checklist

Part 1

Part 2

Part 3


Chapter 27 Project

The Neoclassical Perspective

Purpose

In this chapter, you have learned the building blocks of the neoclassical economic perspective. You have learned that the neoclassical model emphasizes aggregate supply and determinants of productivity, keeping the focus on long-run economic growth. You have studied how price adjustments ultimately bring output levels back to potential GDP within the neoclassical model and how there is no long-run tradeoff between inflation and unemployment.

The purpose of this project is to distinguish between Keynesian and neoclassical economic perspectives and to apply each perspective to economic events in the news.

Directions

This project has two parts. In the first, you will work on your own to distinguish between examples of the Keynesian and neoclassical perspectives. You will also assess the value created by each perspective and apply the neoclassical perspective to the Phillips curve.

In the second, you will work with a classmate to identify and apply both perspectives to economic events in the news.

Part 1 - Distinguishing between Keynesian and Neoclassical Economic Perspectives

Evaluate the following statements and classify each statement as exhibiting a Keynesian perspective or a neoclassical perspective. Be sure to explain your answer.

  1. Congress has approved a stimulus plan to mail economic impact payments of $ 1,200 to taxpayers earning less than $ 75,000 per year.

  2. Cyclical unemployment must be reduced by running a fiscal deficit, shifting aggregate demand to the right.

  3. A voucher system would provide children with greater school choice, leading to increased consumption of higher quality education, ultimately boosting future worker productivity.

  4. A shift toward sales taxes and away from income taxes would provide individuals with increased options to save income. The reduction in interest rates would lead to greater capital investment spending, boosting capital per worker.

  5. The U.S. government should pay for the retraining of those who become structurally unemployed.

  6. Rising export demand due to a thriving global economy will not result in higher long-term output in the U.S. economy.

Review the following hypothetical inflation rates, considering 4 % unemployment to be the level of full employment. Assuming a normal and expected inflation rate of 2 % annually, fill in hypothetical unemployment rates that would be consistent with the neoclassical Phillips curve.

Year Unemployment Rate Inflation Rate
2035 (blank) 10 %
2036 (blank) 7 %
2037 (blank) 4 %
2038 (blank) 0 %

After studying the Keynesian and neoclassical economic perspectives, in your opinion, what are the most valuable takeaways from each approach?

Part 2 - Working in a Group to Apply Economic Perspectives

With a classmate, provide links to two articles that report on a policy initiative that applies the Keynesian perspective. Additionally, find two more articles that report on a policy initiative that applies the neoclassical perspective. For each article, explain how any policies mentioned are focused on long-term or short-term economic effects. Be sure to use articles from trustworthy sources.

Exchange your work with another group. Does your group agree with the connections made by the other group? Explain why or why not. Be sure to include the names of the group members that you exchanged articles with, the articles/links, the connections made by the other group, and your group's feedback.

Checklist

Part 1

Part 2


Chapter 28 Project

Money and Banking

Purpose

In this chapter, you have learned how money is defined and measured, the role banks play in the financial system, and how banks create money through a fractional reserve banking system.

The purpose of this project is to explain money, what happens to money during hyperinflation, and the role of banks in the Great Recession.

Directions

This project has three parts. In the first, you will explore the meaning of money.

In the second, you will define and compare/contrast inflation, hyperinflation, and deflation and which roles of money they affect.

In the third, you will reflect upon and explain the role banks played in creating the housing bubble of the early-to-mid 2000s and its subsequent collapse during the Great Recession of December 2007–June 2009.

Part 1 - Explore the Meaning of Money

Money has a far more expansive meaning than simply the coins and bills we carry around in our pockets. Using both Lesson 28.1 and the following video, evaluate what the true definition of money entails.

In your own words, define money, identify the roles of money, and provide examples of these roles in your own life.

Part 2 - Compare Inflation and Deflation and Describe the Roles of Money

Inflation and deflation incur drastic effects on money and economies. The following resources provide information on the effects of inflation and deflation, along with specific examples:

Compare and contrast the concepts of inflation and deflation.

Identify historical periods of deflation in the U.S. and Japan, and indicate why deflation is a sign of poor macroeconomic health for an economy.

Define the term hyperinflation and which roles of money break down during a period of hyperinflation.

Part 3 - Explain the Role of Banks before and during the Great Recession

Review the following articles on the Great Recession:

Describe what a housing bubble is and the role banks played in creating this bubble with subprime mortgage offerings.

Explain how this housing bubble eventually burst in the U.S., how it was a contributing (and sustaining) factor in the Great Recession, and how the U.S. housing market has changed since.

Checklist

Part 1

Part 2

Part 3


Chapter 29 Project

Monetary Policy and Bank Regulation

Purpose

In this chapter, you have learned about the structure and functions of the Federal Reserve Bank (Fed) in the U.S. You have also learned how banks are supervised, regulated, and insured. Furthermore, you have discovered how the Fed implements monetary policy and quantitative easing, along with how these policies affect broader macroeconomic variables. Last, you have analyzed the potential pitfalls (downsides) of implementing monetary policy in regard to macroeconomic outcomes.

The purpose of this exercise is to understand how the Fed functions and the differences between monetary policy and quantitative easing (QE). You will also compare and contrast the Fed's historical monetary policies.

Directions

This exercise has two parts. In the first, you will read about banks during the Great Recession. Then, you will reflect on this information, using what you learned in the chapter. In the second, you will use resources to review and compare/contrast monetary policy with quantitative easing.

Part 1 - Compare How Bank Regulation Works in Theory versus Lived Experiences

Review Lesson 29.2 and check out the following articles on the Great Recession and its effect on banking:

Explain how the classic model of bank regulation operates and then compare it to the behavior of U.S. banks leading up to and during the Great Recession.

Using specific examples from the articles, explain how the banking sector was reformed in the immediate aftermath of the Great Recession.

Part 2 - Compare and Contrast Traditional Monetary Policy with QE

Review Lesson 29.4 and check out the following articles. Also, consider the video in the first article.

Compare and contrast traditional monetary policy with quantitative easing.

Evaluate the monetary policy/QE regimens during the Great Depression with those employed during the Great Recession. How are they the same? How are they different? What was the effect? Then evaluate the monetary policy/QE regimens during the COVID-19 pandemic. How did it differ from the Great Recession?

Checklist

Part 1

Part 2


Chapter 30 Project

Exchange Rates and International Capital Flows

Purpose

In this chapter, you have learned the determinants of demand and supply for currencies in foreign exchange markets. You have also learned how fluctuations in foreign exchange rates affect various international market participants.

The purpose of this project is to identify the impact of changes in currency markets and research real-world cases of losers due to currency appreciation.

Directions

This project has three parts. In the first, you will apply the concept of currency markets to international trade.

In the second, you will calculate gains or losses from currency exchange and identify changes to currency values due to determinant changes.

In the third, you will identify potential losers from currency appreciation and present cases of actual losers from currency appreciation.

Part 1 - Identifying the Impact of Politically Based Currency Fluctuations

Imagine that a U.S. presidential candidate makes the following statement: "The United States must strengthen the dollar against other currencies. The United States must also reduce its trade deficit."

Will U.S. voters support these statements? Why or why not?

What is the economic benefit of strengthening the U.S. dollar?

What is the benefit of reducing the U.S. trade deficit?

Is it likely that the United States will simultaneously achieve these goals? Explain your reasoning.

Part 2 - Determine the Impact of Economic Currency Fluctuations

A portfolio investor anticipated that during December of 2022, the Canadian dollar would appreciate relative to the United States dollar. The investor purchased 25,000 in Canadian dollars (CAD) on December 2, 2022. Use the data on foreign exchange rates at this webpage to answer the following questions.

How much did the portfolio investor purchase in CAD on December 2, 2022?

Holding all other factors constant, exactly what profit or loss would the portfolio investor earn after purchasing United States dollars on December 31, 2022?

Was this an attempt at arbitrage or hedging? Be sure to explain your answer.

Complete the following chart by determining whether the scenario is expected to cause an increase, decrease, or no change for each of the three columns.

Determinant Change Change in Demand for Canadian Dollar Change in Supply of Canadian Dollar Exchange Rate of Canadian Dollar (CAD/USD)
Financial experts featured on popular news networks predict that the Canadian dollar will depreciate relative to the U.S. dollar. (blank) (blank) (blank)
Real interest rates for Canadian securities are expected to exceed that of the United States. (blank) (blank) (blank)
Inflation rates in Canada have been higher than anticipated, while inflation in the U.S. has remained on target. (blank) (blank) (blank)

Part 3 - Researching the Losers of Currency Appreciation

Provide at least three examples of how a United States firm can be harmed by currency appreciation of the U.S. dollar.

Conduct research and, for each example in your previous answer, provide specific examples of U.S. firms that were harmed by a stronger dollar. Don't forget to cite or provide links to sources.

Exchange your answers for Part 3 with a classmate.

Name of classmate you exchanged responses with:(blank)

Did your classmate cite a negative consequence of a strong dollar that you did not provide in your response?

Out of the examples shared by your classmate, which did you find to be most interesting and applicable to this chapter?

Checklist

Part 1

Part 2

Part 3


Chapter 31 Project

Government Budgets and Fiscal Policy

Purpose

In this chapter, you have learned how the government collects tax revenue and utilizes that revenue in both spending and transfers. You have also learned about how the government uses fiscal policy in an effort to stabilize the economy and the challenges associated with doing so.

The purpose of this project is to identify the role of fiscal policy and to distinguish between ways of carrying out expansionary fiscal policy.

Directions

This project has two parts. In the first, you will work on your own to evaluate sources of federal government tax revenue and identify both challenges and benefits of using fiscal policy to promote a smooth business cycle.

In the second, you will work in a group to debate methods of allocating fiscal stimulus to increase aggregate demand.

Part 1 - Identifying the Role of Fiscal Policy

The Tax Foundation provides a historical record of the tax brackets and rates from year to year. In 2022, the payroll taxes for Social Security were imposed at a rate of 12.4 % up to a certain wage limit; in this case, it is set at $ 147,000 . Medicare, on the other hand, is fixed at 2.9 % with no upper ceiling. The following income tax bracket (Table 1 in Lesson 31.2) shows the tax rate assigned to a single taxpayer's income in 2022.

Income Tax Rate
$ 0 $ 10,275 10 %
$ 10,276 $ 41,775 12 %
$ 41,776 $ 89,075 22 %
$ 89,076 $ 170,050 24 %
$ 170,051 $ 215,950 32 %
$ 215,951 $ 539,900 35 %
$ 539,901 + 37 %

In 2022, Ray earned an income of $ 60,000 . Joan earned $ 30,000 , and Para earned $ 180,000 . Using the information provided, answer the following questions:

  • Who will pay the highest marginal tax rate?

  • Who will pay the lowest marginal tax rate?

  • Who will pay the highest payroll tax rate from their check for Medicare?

  • Who will pay the lowest payroll tax rate from their check for Social Security?

  • Evaluate the validity of the following statement. Is this statement accurate? Why or why not?

    • A progressive income tax rate helps promote smoother business cycles.

  • After studying the differences between expansionary and contractionary fiscal policy, which policy do you believe would be the most politically challenging to implement?

Part 2 - Debating Approaches to Expansionary Fiscal Policy

This part of the assignment will involve two debate teams. Each team, consisting of two classmates, will conduct research to support one of the following positions.

Position A:

Expansionary fiscal policies used to increase aggregate demand during a recession should be delivered in the form of tax cuts. Present the benefits of tax cuts for aggregate demand, historical examples that support this case, and potential negative consequences associated with the alternative of increased government spending.

Position B:

Expansionary fiscal policies used to increase aggregate demand during a recession should be delivered in the form of increased government spending. Present the benefits of increased government spending for aggregate demand, historical examples that support this case, and potential negative consequences associated with the alternative of reducing tax rates.

Who did you work with, and what position did your team represent?

What were your team's primary arguments? These arguments should be supported with historical examples.

Which students represented the opposing debate team?

What were the primary arguments of the opposing team?

After discussing and considering the arguments presented by both debate teams, what allocation of tax cuts and government spending would you suggest for a stimulus package? This question should be answered individually by each debate team member.

Checklist

Part 1

Part 2


Chapter 32 Project

The Impacts of Government Borrowing

Purpose

In this chapter, you have learned how government borrowing affects private investment. You have learned about the trade balance and the concept of the twin deficits of a trade and budget deficit. Furthermore, you have studied the concepts of Ricardian equivalence and crowding out as they pertain to government spending.

The purpose of this project is to explore Ricardian equivalence and crowding out.

Directions

This project has two parts. In the first, you will explore the concept of Ricardian equivalence and how this model holds up in real-world applications.

In the second, you will explain the macroeconomic concept of crowding out, how well the model of crowding out has held up in the real world, and how government grants affect the concept of crowding out.

Part 1 - Exploring the Concept of Ricardian Equivalence

Review Lesson 32.3 and then check out the following articles:

Explain the theory of Ricardian equivalence.

Using details from the Economics Help article (hawkes.biz/Ric1), explain the theoretical problems that exist with the concept of Ricardian equivalence.

Using the Vox article (hawkes.biz/Ric2), explain how well Ricardian equivalence has held up in modeling real-world behavior (with a focus on the European Union).

Part 2 - Explaining the Macroeconomic Concept of Crowding Out

Review Lesson 32.4 and then check out the following:

Define and explain the macroeconomic concept of crowding out in its standard context (of government spending crowding out private spending).

Using the article from the U.S. Tax Foundation (hawkes.biz/Crowding1), explain how well the concept of crowding out has held up in the real world in the United States.

Using the National Bureau of Economics (NBER) articles (hawkes.biz/Crowding2, hawkes.biz/Crowding3), explain how government grants may crowd out fundraising by charities and private donations in the U.S. and UK.

Define the concept of crowding in as it applies to charitable donations by organizations and individuals.

Explain the empirical evidence of crowding in for the U.S. and UK as provided in the NBER and Georgia State University articles (hawkes.biz/Crowding4).

Checklist

Part 1

Part 2


Chapter 33 Project

Macroeconomic Policy around the World

Purpose

In this chapter, you have learned how to make comparisons of aggregate (total) economic well-being across countries on a per capita basis. You have also learned how small differences in economic growth rates lead to large differences in economic outcomes over long periods of time and what constitutes the natural rate of unemployment across different countries. You have studied the causes of unemployment and inflation in different countries and nations' balance of trade issues.

The purpose of this project is to develop an understanding of the rule of 72 and use it to explain how large differences in economic outcomes can occur over long periods of time between nations with disparate rates of annual economic growth. You will also evaluate the meaning of cyclical unemployment and the natural rate of unemployment and describe the problems of youth unemployment.

Directions

This project has two parts. In the first, you will investigate the rule of 72 and utilize it to explain how large differences in economic outcomes have appeared over time.

In the second, you will explore the concepts of cyclical unemployment and the trends of labor unrest and labor strikes.

Part 1 - Investigating the Concept of the Rule of 72

Review Lesson 33.2 and then check out the following articles, including the video at the second link:

Define and explain how the rule of 72 model works.

Using the 2017 article from the Journal of Economics and Finance Education (hawkes.biz/72Rule1) and utilizing the rule of 72, explain how differences in growth rates of China and South Korea massively outperformed long-standing economic powerhouses, such as the U.S. and Germany.

Using the CNBC article and video (hawkes.biz/72Rule2), explain (while providing specific examples) how this formula can work for you, in terms of investing, or against you, in terms of debt.

Part 2 - Exploring the Concepts of Cyclical Unemployment

Review Lessons 33.3 and 33.4 and then check out the following article:

Explain the concepts of cyclical unemployment and the natural rate of unemployment, and describe the problems of youth unemployment.

Which factors do you attribute to the dramatic rise in labor strikes occurring in the U.S. since 2018?

In what ways does the article demonstrate how even a very low unemployment rate by historical standards in the U.S. can mask serious labor unrest? Is this labor unrest justified? Explain.

Do you expect the trend of rising labor unrest (manifesting, in part, in labor strikes) to continue in the U.S. over the next five years? Why or why not?

Checklist

Part 1

Part 2


Chapter 34 Project

International Trade

Purpose

After finishing this chapter, you have learned that gains from trade are made when countries specialize in the production of the goods for which they have a comparative advantage. Let's explore how such gains could apply to everyday life.

The purpose of this exercise is to help you understand absolute and comparative advantage and how society benefits from trade based on comparative advantage.

Directions

This exercise has two parts. In the first, you will identify the absolute and comparative advantages of two producers of food and clothing. In the second, you will consider the gains that could emerge from trade between the two producers and how trade benefits society.

Part 1 - Absolute and Comparative Advantage

Consider two nonprofit disaster relief agencies, The Green Triangle and The Pink Heart, that provide food and clothing to disaster areas. Assume that both The Green Triangle and The Pink Heart pursue the same mission of maximizing the provision of food and clothing in disaster areas. Instead of competing, suppose the two organizations agree to behave like countries and specialize in the production of food or clothing, trade with each other in order to obtain units of both food and clothing, and then distribute the units to different disaster areas. The agencies believe that such an agreement will allow for a greater achievement of their similar missions.

The following table shows the possible combinations of food and clothing The Green Triangle agency can provide with a fixed budget per year:

Food (units per year) Clothing (units per year)
60,000 0
40,000 10,000
20,000 20,000
0 30,000

Create a table similar to the previous one, and fill it out for The Pink Heart so that The Green Triangle has an absolute and comparative advantage in the production of food and The Pink Heart has an absolute and comparative advantage in the production of clothing.

Based on the tables for the two agencies, answer the following questions:

  1. What is the opportunity cost of The Green Triangle producing one unit of food (in terms of clothing)?

  2. What is the opportunity cost of The Green Triangle producing one unit of clothing (in terms of food)?

  3. What is the opportunity cost of The Pink Heart producing one unit of food (in terms of clothing)?

  4. What is the opportunity cost of The Pink Heart producing one unit of clothing (in terms of food)?

  5. Explain why The Green Triangle has an absolute and comparative advantage in the production of food.

  6. Explain why The Pink Heart has an absolute and comparative advantage in the production of clothing.

Part 2 - Gains from Trade and Social Benefit

In Part 1, you identified absolute and comparative advantages for two hypothetical relief agencies. Write an essay analyzing the agreement between the relief agencies. Your essay should be at least three paragraphs long and address these questions:

  1. Which relief agency should provide food and why?

  2. Which relief agency should provide clothing and why?

  3. From the economist's perspective, how should society benefit from the agencies' agreement to specialize and trade? How does the outcome of the agreement compare to the alternative of the agencies being self-sufficient?

  4. Does your answer to #3 change if you consider the question from the perspective of an individual living in a disaster area?

Completion of #4 requires you to think about potential gains from this hypothetical agreement between disaster relief agencies in the context of your own everyday life.

Checklist

Part 1

Part 2


Chapter 35 Project

Globalization and Protectionism

Purpose

After finishing this chapter, you have learned that tariffs, tools for restricting the flow of trade, are associated with both costs and benefits that impact entire countries, producers, and consumers. Let's explore how tariffs relate to your everyday life.

The purpose of this exercise is to help you understand the costs and benefits of tariffs, as well as the considerations of decision makers who must identify whether tariffs are beneficial enough to society to implement.

Directions

This exercise has two parts. In the first, you will consider a tariff imposed on a good important to your life. In the second, you will put yourself in the shoes of a decision maker who must decide whether or not to support the tariff.

Part 1 - How Tariffs Affect Countries, Producers, and Consumers

Tariffs are taxes that governments impose on imported goods and services, which in turn make imports more expensive for consumers. Tariffs are also considered a form of protectionism. While protectionism raises the price of the protected good in the domestic market, domestic producers earn more.

On September 24, 2018, President Donald Trump approved a 10 % tariff on goods imported from China. The motivation behind the tariff was to discourage China from carrying out unfair trade practices with the United States. Some of the taxed goods included mandarin oranges, rawhide for pets, hair care products, dog leashes and collars, luggage, handbags, wrapping paper, gas grills, makeup mirrors, vacuum cleaners, toothbrush replacement heads, razors, air conditioners, futons, patio furniture, wooden furniture, and mattresses.

First, choose one of the products listed previously that you consider to be important in your everyday life.

Then, referring to this chapter, complete a chart for your chosen product with at least five benefits and five costs associated with a 10 % tariff on your chosen product. You may list more if applicable.

When identifying costs and benefits, think both big and small and be specific. Consider both international and domestic effects, as well as the impact on both producers and consumers, including yourself.

Completing your chart requires you to think about this tariff in the context of your own everyday life. The best analysis will be specific and demonstrate not only your understanding of the economic consequences of a tariff but also application to your own experiences as a consumer.

Part 2 - Thinking Like the Decision Maker

In Part 1, you identified the costs and benefits associated with a 10 % tariff on a good considered important in your everyday life. Policy makers must often make similar considerations, as well as weigh the associated costs and benefits to determine whether they merit implementation or discontinuation of the policy. This is particularly challenging when a wide range of economic participants are affected and policies have political implications.

For Part 2, imagine you are asked to make a recommendation to the president regarding continuation of the 10 % tariff on the imports from China. Write a business memo of professional quality that includes the following parts:

  • A confident statement recommending that the tariff be continued or discontinued

  • Justification for your recommendation, generalized from the benefits and costs for your chosen product in Part 1

  • A description of the economic participants affected by your recommendation and how they are affected

  • A suggestion for how the United States should alternatively confront China's unfair trade practices should the tariff be discontinued

To inform your recommendation, consider your analysis in Part 1. The best recommendations will be confidently stated, with justifications that are consistent with economic theory. There is not a single correct analysis; therefore, answers will vary.

Checklist

Part 1

Part 2