All Chapter Projects


Chapter 1 Project

Dream Plans

Owning your own home has always been part of the American Dream. But how feasible is building that home? In this project, you will use Pólya's problem-solving process to estimate the cost of building a house. Assume that you already own the land the house will be built on, and the neighborhood has the following building restrictions.

The house must meet the following parameters:

  • Square footage: 1600 ft 2 to 2400 ft 2

  • Bedrooms: 2 to 4

  • Bathrooms: 1 to 3

  • Other required rooms: kitchen, dining area, living room, laundry room

Step 1:Understand the Problem

  1. The first step is to identify what is being asked of you for this project. Describe in your own words the goal of this project and the steps you will take to complete the project.

Step 2:Devise a Plan

  1. List the different aspects of building a house from initial design to finalizations. Be sure to consider both physical labor required and materials to be purchased. (Note: You do not need to list specific costs, only the categories.)

  2. Do some research to determine an estimated cost per square foot. Describe what considerations went into estimating the overall cost. Be sure to state where the house will be built.

Step 3:Carry Out the Plan

  1. Determine the number of bedrooms, bathrooms, and total square footage of your home. Include the dimensions of the rooms and as much detail as possible.

Step 4:Look Back

  1. Determine a rough estimate for the cost of the house designed in Step 3 and the cost per square foot from Step 2.

  2. How does the estimated cost of your house compare with the real estate market in your city or town? What source(s) did you use to make the comparison?

  3. Name at least two factors that might cause the cost of building your house to be more than you estimated. Explain how you can decrease the cost of building the house.

  4. Name at least two things you learned in the process about building a house.

  5. What would you change about your original house plan based on your findings?

Chapter 2 Project

Ready… SET… Go

Venn diagrams can be a useful way to display the results of a survey with multiple questions. At a glance of the diagram, you can get a general feel of the ways in which the experiences or knowledge of a group of people overlap. In this project, you will collect data in a survey and then use a Venn diagram to analyze the results.

Step 1:Design the Survey

Create a survey with 3 questions that are binary in their responses. In other words, each question on the survey has only 2 options to choose from. (This is easiest if you think of yes/no questions.) You may use the following questions or come up with some of your own. If you choose to make up questions on your own, remember that they must only have a choice of 2 responses.

  • Were you born in this state? [Note: Specify which state.]

  • Have you ever traveled to another country?

  • Can you fluently speak another language besides English?

  1. Create three questions if you choose not to use the ones above.

  2. How many possible answer combinations are there?       

Step 2:Collect and Organize the Data

  1. Survey 50 people using your chosen questions and record their answers in a table similar to the one shown here. You will need to complete the table to include all of the possible combinations of responses.

Survey Results
Number of Responses Born in This State? Traveled to Another Country? Fluently Speak Another Language?
Yes Yes Yes
Yes Yes No
Yes No Yes

Step 3:Display the Data

Now that you've collected and organized the data, it's time to display the results with a 3 -circle Venn diagram like the one provided.

A venn diagram containing three interconnecting circles, labeled A, B, and C, inside a rectangle labeled U.
  1. Begin by labeling the circles. Think about what type of labeling your Venn diagram will require. How will you label the circles?

  2. As you begin to populate the circles with the response numbers, where should you start?

  3. Finish populating your diagram with results.

Step 4:Analyze and Interpret the Results

Answer the following about your survey using complete sentences.

  1. Using the Venn diagram you created, summarize your results.

  2. What conclusions can you draw from the Venn diagram?

  3. Why was it important that the questions only had a choice of 2 responses?

Step 5:Collect and Organize New Data

  1. Now survey 50 different people using the same questions. Record your results in the same manner as above.

Step 6:Display

  1. Using the same method as before, draw a second Venn diagram to display the results of the second survey.

Step 7:Analyze and Interpret

Answer the following about your survey.

  1. Using the second Venn diagram, summarize the second set of responses that you gathered.

  2. What conclusions can you draw from this Venn diagram?

Step 8:Compare

Answer the following questions using complete sentences in order to compare the diagrams.

  1. Do the two Venn diagrams look the same? If the Venn diagrams are not the same, describe how they are different.

  2. What do you think a Venn diagram would look like if it contained the results from all 100 people you surveyed combined?

  3. Would you be able to draw any more conclusions with the data combined? Why or why not?


Chapter 3 Project

Keeping the Lights On

Electronic circuits are a major part of our everyday lives whether we are conscious of it or not. Alarm systems, computers, diagnostic medical equipment, Christmas lights, and even a clothes dryer all use logical circuit systems. The truth tables that we've been studying in this chapter actually have a direct use in designing these circuits. Let's take a look at how they correspond.

Recall that each variable in a truth table can either be true or false at any given time, but not both at the same time. The same is true of a switch. It can either be on or off, but not both, at any given time. In a digital circuit we associate true with on and false with off.

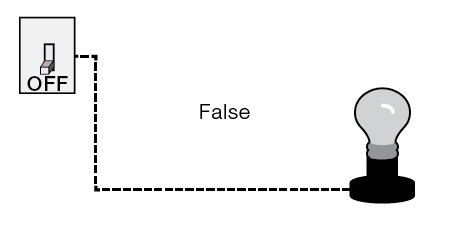
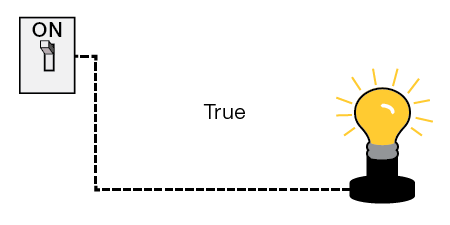
For instance, if we have a circuit variable that controls a light bulb, when the variable is true, the light is on, and vice versa, as shown in the following diagrams.

A circuit labeled True with a switch set to ON and a lightbulb that is also on. A circuit labeled False with a switch set to OFF and a lightbulb that is also off.

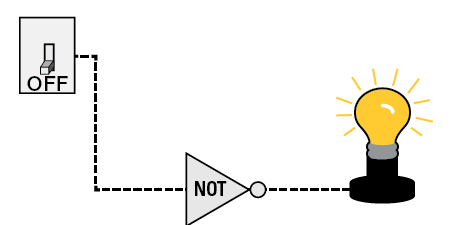
Just as in truth tables, digital circuits can be constructed using logic. The logical connectives for digital circuits are called logic gates. We can add NOT gates, OR gates, or AND gates to any circuit to manipulate the output. As you might imagine, the NOT gate produces an opposite value of the switch as its output. In fact, all the logic gates behave in exactly the same manner as logic symbols in truth tables. For example, suppose we'd like the light to be on when the switch is actually off (or false). We can add a NOT gate to our circuit so the output means the light is on when the switch is off, as shown below.

A circuit with a Not gate with a switch set to OFF and a lightbulb that is on.
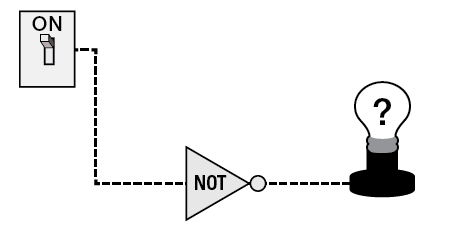
  1. What would happen to the light bulb in this circuit if the switch is on?

  2. A circuit with a Not gate with a switch set to ON and a lightbulb that is off.

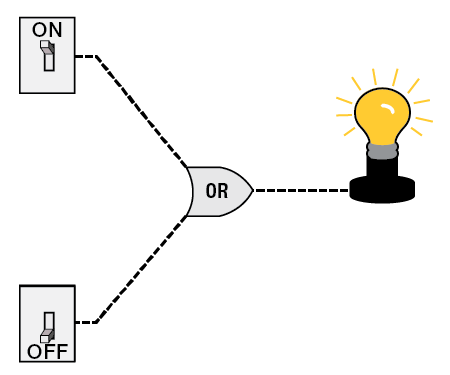
When we have two switches, we can introduce the OR gate so that the light bulb is on if at least one switch is on.

Two switches with an or gate

A circuit with two switches leading to an Or gate. The first switch is set to ON. The second switch is set to OFF and leads to a Not gate. The lightbulb is on.

Notice that if we reverse the position of each switch, the light bulb would still remain on. The same is true if both switches are on. However, if both switches were in the off position in this circuit, the light bulb would then turn off.

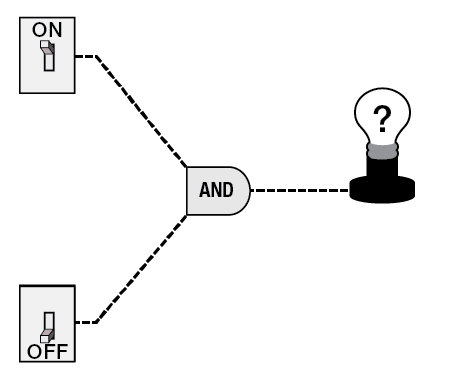
  1. Now think about what would happen to the light bulb with a circuit where there is an AND gate in place. Fill in each blank below.

    Two switches with an and gate

    A circuit with two switches leading to an And gate. The first switch is set to ON and the second switch is set to OFF. The lightbulb is labeled with a question mark.

    1. If one switch is on and one is off, the light bulb is    .

    2. If both switches are on, the light bulb is    .

    3. If both switches are off, the light bulb is    .

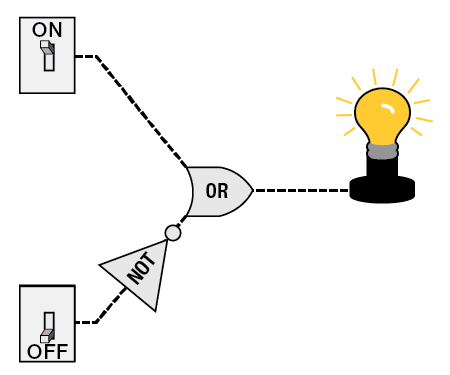
Of course digital circuits can have multiple gates as well as switches, like the one shown below.

Two switches with an or gate

A circuit with two switches leading to an Or gate. The first switch is set to ON. The second switch is set to OFF and leads to a Not gate. The lightbulb is on.

  1. For the above diagram, determine the output of the light bulb for each of the four combinations of the switch positions.

    1. Top switch on, Bottom switch off:    

    2. Top switch on, Bottom switch on:    

    3. Top switch off, Bottom switch on:    

    4. Top switch off, Bottom switch off:    

  2. Now it's your turn to design some circuits. (Part c. will require some thought, maybe even some trial and error on your part.)

    1. Design a circuit with two switches and at least two gates in which the light is on when at least one switch is off.

    2. Design a tautology circuit with two switches and at least two gates (that is, the light bulb is always on).

    3. Design a circuit with two switches and at least two gates in which the light is on when precisely one switch is on.

  3. Describe a scenario in which the circuits you designed in Questions 4 and 5 could be used to control something. For example, they could control the switches for the buzzer in a quiz match or spotlights for a concert when certain musicians are on the stage. Explain your scenario in detail, noting what each circuit controls and when it will and won't be activated.


Chapter 4 Project

The Federal Budget–Where Do My Taxes Go?

When it comes to spending money, the United Stated government is similar to a family. There are bills to pay, and in order to pay these bills, the government must generate revenue and create a budget to allocate those funds. The main source of revenue for the government comes from collecting taxes. When the government spends exactly as much as it generates in revenue, we say that the government has a balanced budget. In this project, you will examine the 2019 US federal budget and compare it to a family budget and the 1999 US federal budget.

The following table6 lists the main expenditure categories for the fiscal year 2019.

US Federal Government 2019 Budget
Expenditure Category Approximate Amount Spent (US dollars)
Social Security 1 trillion
Medicare and Medicaid 1.1 trillion
Defense 697 trillion
Nondefense 661 trillion
Interest on Debt 375 trillion
Other 567 trillion
Total 4.40 trillion
  1. The entire revenue from federal taxes in fiscal year 2019 was approximately equal to 3.5 trillion dollars. Determine the difference between the total expenditures and the revenues in 2019.

  2. Since the government spent more than the revenue brought in, we call the difference you found in part a. the fiscal deficit for 2019. The fiscal deficit is typically given as a positive value. Economists often compare the fiscal deficit to the entire economic output of the nation. The economic output is the total amount of money produced by the economy, which is known as the Gross Domestic Product (GDP). Perform an internet search and find the United States 2019 GDP.

  3. What percentage of the 2019 GDP was the federal deficit in 2019? (Round your answer to the nearest tenth.) This number is known as the deficit-to-GDP rate. Would it be better for the country to have a higher or lower deficit-to-GDP rate? Explain your reasoning.

  4. There is a lot of discussion among economists about what is considered an acceptable deficit-to-GDP rate. The general consensus is that a number under 2 % is acceptable as a rate that isn't too concerning. If all the US expenditures remained the same in 2019, what would the revenue (in dollars) have to be to attain a 2 % deficit-to-GDP rate? Without increasing economic output (that is, keeping the GDP the same), how could the government generate more revenue?

  5. Some amounts in the budget cannot be changed. For example, Social Security must be paid to everyone that is entitled to receive it. On the other hand, the amounts for other certain categories are set by Congress and can be negotiated. Perform an internet search on discretionary expenses versus non-discretionary expenses. Write down the definition of each expense and provide an example of each expense in the federal budget.

  6. If the total revenue and GDP remain the same, what change to the budget would be necessary to attain a 2 % deficit-to-GDP rate? What specific area(s) would you target for making the change? Explain your reasoning.

  7. Let's compare the deficit to the actual revenues. What percentage of the 2019 total revenue is the 2019 deficit?

  1. Now, suppose that a family of four has an income of $ 63,000 per year. If this family had the same deficit to revenue rate that the federal government had in 2019, how much would they have to borrow every year to pay their bills?

  2. List some methods that the family (and the federal government) could use to balance its budget. In both cases, list some discretionary and non-discretionary expenses that could be adjusted.

In 1999, things were a bit different for the US economy. The 1999 budget had expenditures totaling 1.7 trillion dollars and revenues of 1.826 trillion. Back then, the government was bringing in more money than it spent. In cases like this, we call the difference between revenue and expenditure a surplus.

  1. Calculate the 1999 federal surplus in billions of dollars by finding the difference between the expenditures total and the revenues.

  2. Perform an internet search to find the United States 1999 GDP.

  3. Determine the surplus-to-GDP ratio in 1999.

  4. What was the percentage change in government spending between 1999 and 2019?

  5. Now, determine the percentage change in GDP between 1999 and 2019.

  6. Argue how the difference between the percentage change of government spending and the percentage change in GDP can be used to partially explain the emergence of large deficits in the federal budget.

  7. Calculate the percentage of the revenue that was the surplus in 1999.

  8. Suppose that our family of four had the surplus-to-revenue ratio that the federal government had in 1999. How much would they have saved at the end of the year?

6 "Policy Basics: Where Do Our Federal Tax Dollars Go?" Center on Budget and Policy Priorities, Updated April 9, 2020, https://www.cbpp.org/research/federal-budget/where-do-our-federal-tax-dollars-go.


Chapter 5 Project

Those Pesky Mosquitos

According to the Center for Disease Control and Prevention, the Zika virus is a disease "spread to people primarily through the bite of an infected Aedes species mosquito." Although the virus was first discovered in 1947, the first human case wasn't documented until 1952. Since then, outbreaks have been reported in Africa, Southeast Asia, and the Pacific Islands. So far, 86 countries and territories worldwide have reported evidence of mosquito-transmitted Zika infection. One of the latest epidemics of the Zika virus occurred between 2013 and early 2014, on a cluster of islands in the South Pacific called French Polynesia. Let's have a look at how fast it spread.

  1. Based on what you've heard or know about viruses and your knowledge about functions, what type of growth do you think usually describes epidemics—exponential, polynomial, logarithmic, or linear? Explain your reasons for your choice.

  2. The following table contains data of the weekly number of suspected Zika cases in French Polynesia in 2013 during the first four weeks of the outbreak. Plot the data on a graph.

    Week # New Cases Cumulative Cases
    1 49 49
    2 191 240
    3 369 609
    4 331 940
    5 333 1273
  3. Here are five different functional models that might represent the growth of the number of Zika cases,where x represents the week number, and y represents the number of cumulative cases.

    1. Linear y = 258.74 x

    2. Logarithmic y = 937.37 ln x 202.03

    3. Quadratic y = 31.357 x 2 + 134.93 x 122

    4. Power y = 55.278 x 2.0101

    5. Exponential y = 47.399 e 0.6737 x

    For each function model listed, create a graph for 1 x 5 , along with the Zika case data from part 2. Be sure your graphs clearly label the function and the actual data.

  1. Which of the graphs in Step 3 do you think best models the Zika data? Why?

  2. On the graphs from Step 3, extend the graphs by plotting the functions for 6 x 10 .

  3. Which of these functions do you think will best model the growth of the number of Zika cases over weeks 6 through 10 ? Is it the same function as you choose in Step 4? If not, what caused you to change your decision?

  4. The following table contains the actual data for the spread of the Zika virus during weeks 6 through 10 of the epidemic.

    Week # New Cases Cumulative Cases
    6 571 1844
    7 742 2586
    8 955 3541
    9 1029 4570
    10 883 5453

    Plot the actual data for weeks 6 through 10 on each of the function graphs. Is the function you chose in Step 6 still the best model for growth over weeks 1 through 10 ? Why or why not?

  5. The following table contains the data for weeks 11 through 20 . Plot the Zika data for weeks 1 through 20 on each of the function graphs. Discuss when each function ceases to be a good model for the data and why that might be.

    Week # New Cases Cumulative Cases
    11 682 6135
    12 512 6647
    13 412 7059
    14 381 7440
    15 343 7783
    16 256 8039
    17 247 8286
    18 142 8428
    19 82 8510
    20 17 8581
    Ioos S, Mallet HP, Leparc Goffart I, Gauthier V, Cardoso T, Herida M. "Current Zika virus epidemiology and recent epidemics."
    Med Mal Infect (July 2014): 44(7):302-7 doi: 10.1016/j. medmal.2014.04.008. Epub 2014 Jul 4.
  6. The population of French Polynesia at the time of the outbreak was about 270,000 . The population of the United States in 2016 is approximately 322,762,000 . How could you modify your function to model a potential spread of the Zika virus over the United States?

  7. Discuss if it is reasonable to use your modified Zika function model for French Polynesia as a model for the United States.


Chapter 6 Project

Defined Benefit Versus Defined Contribution: Two Types of Retirement Plans

In this chapter, you learned about the power of interest and the importance of budgeting in order to plan for your future financial health. In this project, we will explore the two main types of retirement plans available in the United States: defined-benefit plans and defined-contribution plans.

In a defined-benefit plan (or a pension plan), an employee is guaranteed life-long income after retirement. The size of the income received after retirement is usually determined by the employee's years of service and salary at the time of retirement. The employer is responsible for all the planning and managing of risk associated with this type of plan.

  1. Perform an internet search for "defined-benefit plans". List two advantages and two disadvantages of this type of plan for the employee. List two advantages and two disadvantages for the employer. What kind of employers usually offer a defined-benefit plan?

In a defined-contribution plan, the employee (and often the employer) makes contributions to an investment account. Two common plans of this type are 401(k)s and IRAs. The size of income received after retirement is determined by the balance in the account and other market factors. With this type of plan, the employer does not have any responsibility towards the planning or managing the risk of the account.

  1. Perform an internet search for "defined-contribution plans". List two advantages and two disadvantages of this type of plan for the employee. List two advantages and two disadvantages for the employer. What kind of employers usually offer a defined-contribution plan?

Suppose that a small town has a pension fund that is expected to make annual payments totaling $ 500,000 to its local government retirees. The fund must be able to sustain such payments in perpetuity; that is, forever. The easiest way for this to happen is if the town is able to set aside $ 500,000 every year to pay its retirees.

  1. What are some ways the town could secure the funds for the retirees? Think about ways local governments can generate revenue. Do you believe these revenue streams are sustainable in the long run? Explain.

Another possibility to sustain the fund would be to plan ahead. The town could allocate and invest money for its pension fund from the time the first local government employee is hired to the time they retire, 30 years later. In order to simplify our calculations, let's assume that the town will set aside an amount d on year 1 to pay for the first year of retirement for all local government retirees 30 years later. The town council believes it can earn 7 % annual interest on the account.

  1. Calculate the amount d that the city must set aside that first year. Does the 30 -year plan work in favor of the town? Explain.

Now, let's assume that the budget committee has allocated the amount found in part 4 for investment each year. Consider the unfortunate event of the market turning sharply downwards, resulting in a 4 % rate of return on the account per year instead of the anticipated 7 % .

  1. Use the answer from part 4 to calculate the amount available in the retirement fund after 30 years? (Hint: calculate the future value of a single deposit made on the first year.)

  2. What does your answer in part 5 say about the ability of the town to fulfill the pension obligation to its retirees after 30 years?

  3. Discuss any changes to the town's predicament if they invested the same amount in a 401(k) without any guarantees of income.

  4. If you were the manager of a small town's pension fund, would you prefer to offer a pension fund or a 401(k) to your employees? Explain.

  5. If you were an employee of a small town, would you rather be enrolled in a pension plan or a 401(k)? Explain.


Chapter 7 Project

A Meeting of Civilizations

A wandering wormhole picked up a community from each of the following civilizations and placed them in relatively close distance to each other on a new, habitable planet: Mayans, Babylonians, and Greeks. Once the Babylonians adjusted to their new surroundings, they set out exploring and discovered the Mayan civilization. After working through the communication difficulties of having different languages, the two communities decided to set up a trade system. However, since their numeration systems were so different, they first had to figure out how to translate values between the two systems.

  1. First, we need to determine the basics of each numeration system. Determine the base number systems used by the Babylonians and the Mayans.

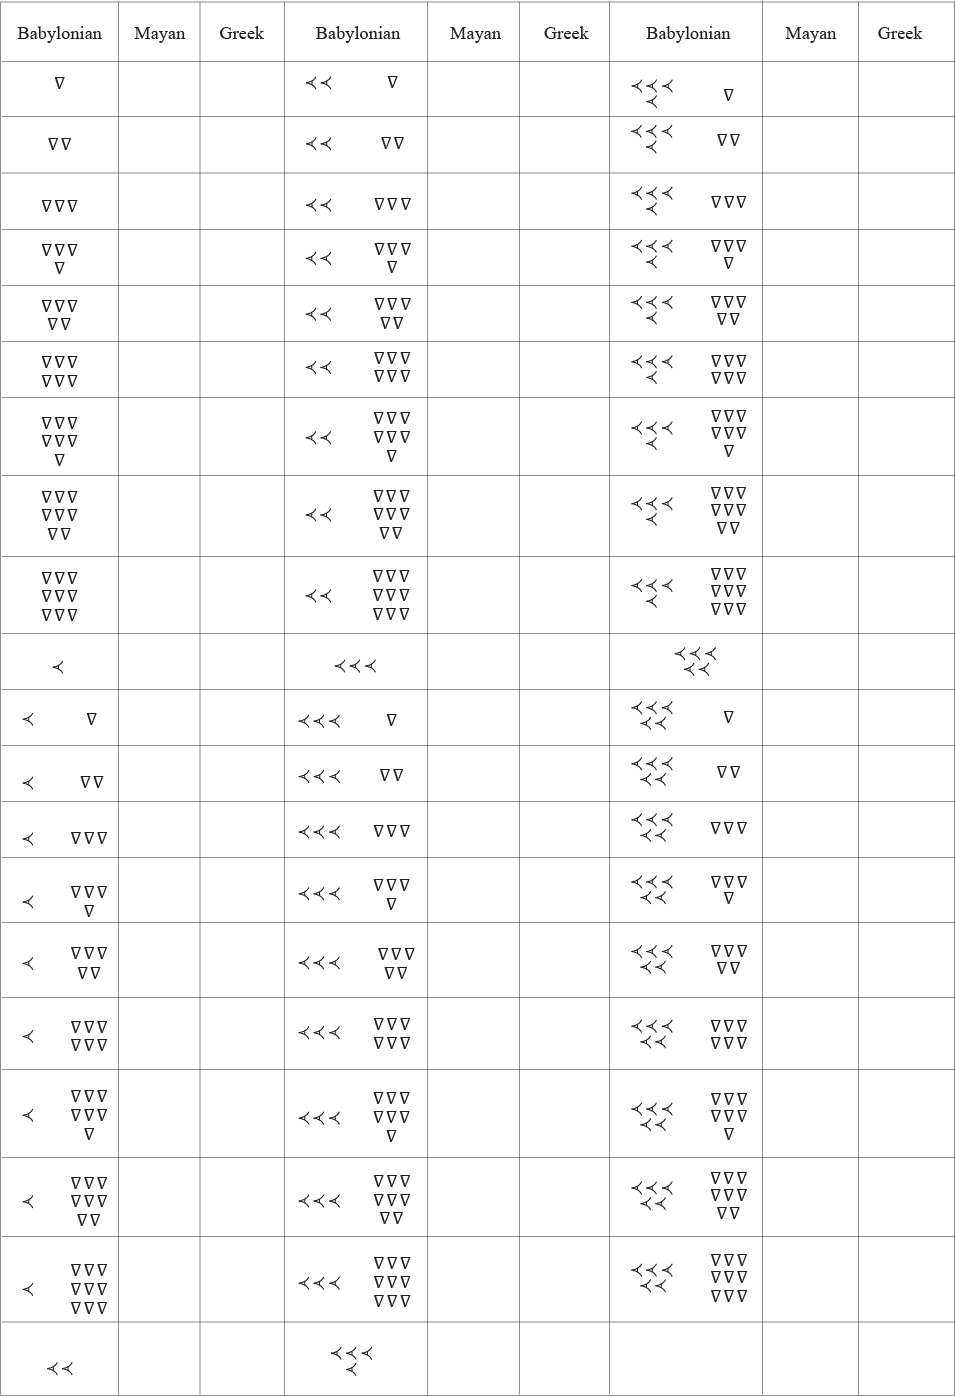
  2. To initiate numerical conversions between the two civilizations, the Babylonians decided to create a table of the numerals from 1 through 59 . Fill out the table (provided on the next page) of the first 59 values of the Mayan numeration system. (The Babylonian numeration system has been provided.)

  3. Describe how place value is represented in each numeration system. What kind of difficulties or confusions might arise from the differences in writing larger numbers between the systems.

  4. Mathematical communication between the two civilizations holds some difficulty because each uses a different base number system and has different symbols for numerals. The Mayan system adds another layer of complexity by having a symbol for zero. How would you explain the use of the symbol to zero to someone who is not familiar with the idea? What difficulties might arise from one system having a zero symbol and the other not having it? Would you, as a user of the Mayan system, try to convince the users of the Babylonian system to adopt the zero symbol or would you give up the zero symbol for communication purposes?

  5. To convert numbers from the Babylonian system to the Mayan system (and vice versa), the two civilizations would not have converted the values first to base 10 . This is because neither civilization used a base 10 system. Describe how a method the two civilizations might use to convert numbers to and from each system. (Hint: Are there any patterns? Would a larger conversion table be necessary? Can you think of any other methods they might use?)

  6. After setting up a trade system with the Mayans, the Babylonians continued their exploration of their new world and discovered the Greek civilization. After working through the communication difficulties of having different languages, the two communities decided to set up a trade system. Determine the base number system used by the Greeks. Does the Greek system a positional system?

  7. The Babylonians decided to add the Greek numerals to their table of Babylonian and Mayan numerals. Add the first 59 numerals of the Greek system to the table.

  8. Which of the two systems of most similar? Explain how the two systems are similar and explain how they are different.

  9. To simplify trade, the three civilizations adopted a unified currency: gold coins. The Babylonians are the first to advertise a deal to both civilizations. They are willing to sell Babylonian numeral: two left arrowheads and four downward triangles for twenty-four bales of hay for Babylonian numeral: three downward triangles for three gold coins. Convert these values to both the Mayan and the Greek system.
  10. The Greeks advertise that they are willing to sell bundles of wool to the other two civilizations. The wool comes in uniformly sized bundles. They are willing to sell ρ bundles of wool for μ ε gold coins. Convert these values to both the Babylonian and the Mayan system.

  11. The Mayans consider the offer from the Greeks and respond that they are only willing to pay  Mayan numeral: two dots over a shell for forty  gold coins for  Mayan numeral: one horizontal bar over a shell for one hundred  bundles of wool. The Greeks counteroffer with English character Q represents koph.ε bundles of wool for μ gold coins. The Mayans agree to the new deal as long as the Babylonians can also have the same deal. The Greeks accept. Translate the Mayan offer to Greek numerals and translate the Greek counteroffer into both Mayan numerals and Babylonian numbers.

Babylonian Mayan Greek
Babylonian Numeral: one downward triangle
Babylonian Numeral: two downward triangles
Babylonian Numeral: three downward triangles
Babylonian Numeral: four downward triangles
Babylonian Numeral: five downward triangles
Babylonian Numeral: six downward triangles
Babylonian Numeral: seven downward triangles
Babylonian Numeral: eight downward triangles
Babylonian Numeral: nine downward triangles
Babylonian Numeral: one left arrowhead
Babylonian Numeral: one left arrowhead and one downward triangle
Babylonian Numeral: one left arrowhead and two downward triangles
Babylonian Numeral: one left arrowhead and three downward triangles
Babylonian Numeral: one left arrowhead and four downward triangles
Babylonian Numeral: one left arrowhead and five downward triangles
Babylonian Numeral: one left arrowhead and six downward triangles
Babylonian Numeral: one left arrowhead and seven downward triangles
Babylonian Numeral: one left arrowhead and eight downward triangles
Babylonian Numeral: one left arrowhead and nine downward triangles
Babylonian Numeral: two left arrowheads
Babylonian Numeral: two left arrowheads and one downward triangle
Babylonian Numeral: two left arrowheads and two downward triangles
Babylonian Numeral: two left arrowheads and three downward triangles
Babylonian Numeral: two left arrowheads and four downward triangles
Babylonian Numeral: two left arrowheads and five downward triangles
Babylonian Numeral: two left arrowheads and six downward triangles
Babylonian Numeral: two left arrowheads and seven downward triangles
Babylonian Numeral: two left arrowheads and eight downward triangles
Babylonian Numeral: two left arrowheads and nine downward triangles
Babylonian Numeral: three left arrowheads
Babylonian Numeral: three left arrowheads and one downward triangle
Babylonian Numeral: three left arrowheads and two downward triangles
Babylonian Numeral: three left arrowheads and three downward triangles
Babylonian Numeral: three left arrowheads and four downward triangles
Babylonian Numeral: three left arrowheads and five downward triangles
Babylonian Numeral: three left arrowheads and six downward triangles
Babylonian Numeral: three left arrowheads and seven downward triangles
Babylonian Numeral: three left arrowheads and eight downward triangles
Babylonian Numeral: three left arrowheads and nine downward triangles
Babylonian Numeral: four left arrowheads
Babylonian Numeral: four left arrowheads and one downward triangle
Babylonian Numeral: four left arrowheads and two downward triangles
Babylonian Numeral: four left arrowheads and three downward triangles
Babylonian Numeral: four left arrowheads and four downward triangles
Babylonian Numeral: four left arrowheads and five downward triangles
Babylonian Numeral: four left arrowheads and six downward triangles
Babylonian Numeral: four left arrowheads and seven downward triangles
Babylonian Numeral: four left arrowheads and eight downward triangles
Babylonian Numeral: four left arrowheads and nine downward triangles
Babylonian Numeral: five left arrowheads
Babylonian Numeral: five left arrowheads and one downward triangle
Babylonian Numeral: five left arrowheads and two downward triangles
Babylonian Numeral: five left arrowheads and three downward triangles
Babylonian Numeral: five left arrowheads and four downward triangles
Babylonian Numeral: five left arrowheads and five downward triangles
Babylonian Numeral: five left arrowheads and six downward triangles
Babylonian Numeral: five left arrowheads and seven downward triangles
Babylonian Numeral: five left arrowheads and eight downward triangles
Babylonian Numeral: five left arrowheads and nine downward triangles

Chapter 8 Project

INVESTIGATING NUMBER SEQUENCES

Number theory is sometimes studied simply for the love of math. There is a beauty in finding patterns in sequences of numbers and learning how these sequences overlap with different areas of study. In this project, you will investigate two sequences of numbers and learn how their patterns interact with each other and the golden ratio.

  1. The Fibonacci numbers form a sequence of numbers that have a distinct pattern. The first six values of the Fibonacci numbers are as follows.

    0 1 1 2 3 5

Write a description for the pattern that forms these Fibonacci numbers. (Hint: Write sentences to describe how to obtain the next four values in the sequence if the first two values are given.)

  1. Using the pattern described in part 1, write the first 15 numbers of the Fibonacci numbers.

  2. The notation for each value in the Fibonacci sequence is F n where n is nth term of the sequence, starting at n = 0 . This means that F 0 = 0 and F 1 = 1 . One way to think of the Fibonacci sequence is that the pattern described in part 1 is "seeded" with the values F 0 = 0 and F 1 = 1 . Describe the sequence Y n that would be created with the same pattern if it were seeded with the values Y 0 = 1 and Y 1 = 0 . (Hint: List out the first 10 digits of the sequence.)

  3. The Lucas numbers L n form a sequence of numbers that share the same pattern as the Fibonacci numbers, but the sequence is seeded with L 0 = 2 and L 1 = 1 . List out the first 15 numbers of the Lucas numbers. (Hint: Use the pattern that was described in part 1.)

  4. Compare the Fibonacci numbers with the Lucas numbers. Are any values the same? Do any values match up exactly between the two sequences (that is, does F n = L n for any values of n)? Which sequence seems to grow in size the fastest?

  5. The golden ratio is a mathematical property that has been studied since 300 B.C. Perform an internet search and write a short description of the golden ratio. Include the value of the golden ratio rounded to the nearest millionth. Be sure to describe the use of the golden ratio.

  6. Find the ratio of the two largest values of the Fibonacci numbers that were listed in part 2. Find the ratio of the two largest Lucas numbers that were listed in part 4. Round the ratios to the nearest millionth. Compare these two ratios to the value of the golden ratio. Does either the Fibonacci ratio or the Lucas ratio match the golden ratio? How can we improve our investigation into whether each series satisfies the golden ratio?

  7. Pick two new seeds for the pattern described in part 1 and list the first 15 values.

  8. Compare the values of the new sequence of numbers you created in part 8 to both the Fibonacci numbers and the Lucas numbers. Are any values the same? Do any values match up exactly? Does the new sequence grow faster or slower than the Fibonacci numbers and Lucas numbers?

  9. Find the ratio of the two largest values of the new number sequence you created in part 8. Round the ratio to the nearest millionth. Compare this value to the golden ratio. Does it match the golden ratio? Does it match the golden ratio any better or worse than the Fibonacci numbers and Lucas numbers?

  10. Do you think that using different seed values for the pattern described in part 1 would result in a ratio that matches closer to the golden ratio? Explain your reasoning.


Chapter 9 Project

It's all in the packaging

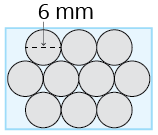
As a member of the design team at Palisade Pharmaceuticals, you've been assigned the job of creating part of the packaging for the company's new syringe line. The packages will be sold to retailers in multiples of 10 syringes, and your job is to minimize the packaging for each bundle. Each plastic 1 mL syringe has a diameter of 6 mm and a length of 84 mm .

Part I – Minimum Surface Area

Begin by deciding on the best way to bundle the 10 syringes together; you want to have the smallest surface area in your design. We will try bundling the 10 syringes in both a rectangular format and a triangular format. For each possible configuration, calculate the minimum area that would be required to cover the top of that particular bundle of syringes. Be sure to show your calculations. Round your answers to the nearest hundredth.

  1. Rectangle

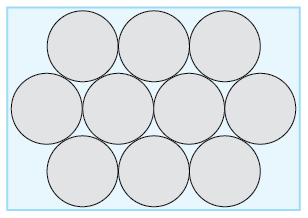
    The syringes are arranged so that the top of the syringes form the smallest possible rectangle. In order to find the surface area needed to package them, we need to find the area of this rectangle.

    Box of 10 syringes of diameter 6 mm

    A rectangle containing three rows of equally sized circles. The top row contains three circles, the middle row contains four circles, and the bottom row contains three circles. One circle is labeled with a diameter of six millimeters.

    1. Let's start with the length L of the rectangle. This is the easier of the two measurements to calculate. On the following figure, mark the center of each syringe in the middle row. Then draw a line through the centers that represents the length we need to find.

      The previous diagram without the diameter shown
    2. Using the line you just created, determine the general formula for the length L of the rectangle in terms of the diameter d of each syringe.

    3. Now use your formula and the information given about the syringes to calculate the actual length of the rectangle needed to cover the syringes.

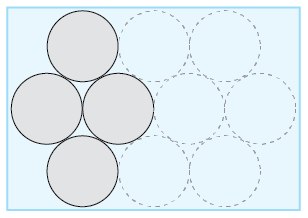
    Next we'll calculate the width of the rectangle needed. As you are calculating this side, be careful to note that the circles are not sitting directly on top of one another. This allows for the smallest rectangle possible. Let's take a closer look.

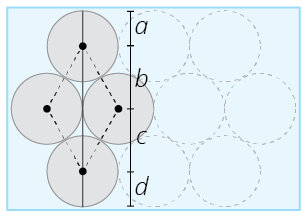
    Once again, mark the center of each syringe. By using the radius of each circle, connect the centers of the four syringes shown in such a way that you form two triangles sitting on top of each other. Label each radius r.

    Box of 10 syringes with the left-most syringes highlighted

    The previous diagram with the first circle in the first row highlighted, the first two circles in the second row highlighted, and the first circle in the third row highlighted.

    1. Use either trigonometry or the Pythagorean Theorem to find the height h of each triangle you drew based on the radius r. Show your work.

    Now that you have the height of each of your triangles, you are ready to determine the width of the rectangle needed to cover the syringes. In the following figure, we have drawn a line representing the width of the rectangle broken into lengths a, b, c, and d. You are now equipped to find each of these lengths in terms of r.

    Box of syringes with a diamond shape drawn using the centers of each highlighted circle

    The previous diagram with the centers marked on the highlighted circles. The centers are connected with dotted lines, creating a diamond. A vertical line extends from the top of the top cirlce to the bottom of the bottom circle. It is broken into four segments, the separations corresponding to the marked centers in each row. From top to bottom, the line segments are labeled a, b, c, d.

    1. Create a formula for the width of rectangle in terms of r.

    2. Use the formula created in Step 5 and the information given to calculate the actual width of the rectangle covering the syringe bundle.

    3. Finally, calculate the minimum area needed to cover the top of the rectangular bundle of syringes.

  2. Equilateral Triangle

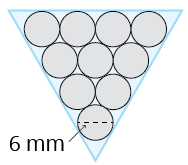
    In the triangular configuration, the syringes are arranged so that the top of the syringes form the smallest possible triangle. In order to find the area the triangle covers, we need to know the height of the triangle and the length of one of the sides. Notice that this is an equilateral triangle, so any of the sides will do.

    A triangle containing 10 syringes of diameter 6 mm

    A triangle containing four rows of circles. The first row contains four circles, the second row contains three circles, the third row contains two circles, the fourth row contains one circle. One circle is labeled with a diameter of six millimeters.

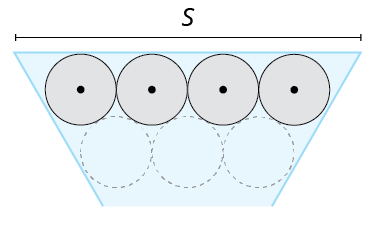
    Let's start by finding the length of the sides of the triangle. We've enlarged one of the sides for you in the following figure and indicated the centers of the syringes.

    The top two rows of syringes from the previous diagram with the centers marked

    From the previous diagram, the first two rows are shown with the top row highlighted. The centers of each circle in the top row has been marked. The side of the triangle is labeled as S.

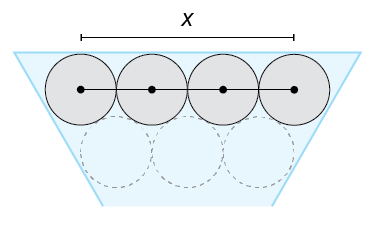
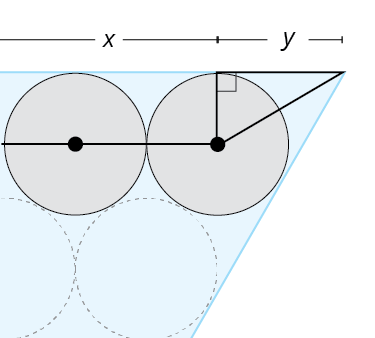
    1. Notice in the next figure that we can determine part of the length of S by using the radius of each syringe. Give the length of x, shown in the figure, in terms of r.

      From the previous diagram, the length between the centers of the first and last circles is labeled as X.
    2. Now, let's find the remaining portion of side S. We'll zoom in closer to the right side. We can create a triangle in the corner using the radius of the circle as our base, as shown. (Note: This is the same triangle that we found the height of in the first layout design. So the length of y is the same as the earlier height h.) Determine the length of y in terms of r.

      A right triangle formed from the center of the last circle and the corner of the triangle

      From the previous image, the last two circles in the row are shown. From the last circle, two lines are drawn from the center of the cirlce, one perpendicular to the edge of the triangle and the second to the corner of the triangle. This creates a right triangle with a base labeled as y.

    3. Now, determine the total length of a side of the triangle in terms of r.

    4. Since this is an equilateral triangle, you can now use the Pythagorean Theorem to find the height of the triangle. Round your answer to the nearest hundredth. Show your work.

    5. Using the lengths of the sides and height of the triangle, calculate the minimum area needed to cover the top of the triangular bundle.

    6. Which configuration in Part I, the rectangle or triangle, requires the smaller area to cover the top of a bundle of 10 syringes?

    Part II – Packaging

    1. For each bundle configuration, calculate the minimum total surface area of a three-dimensional package needed for the 10 syringes. Show your calculations.

      1. Rectangle:

      2. Triangle:

    2. Which of the configurations would you recommend to the design team at Palisade Pharmaceuticals? Explain your reasoning.

    Part III – For Consideration

    1. Suppose you changed the diameter of the syringes. Would the most efficient packaging stay the same? Why or why not?

    2. Consider other configurations for the bundles. Can you find a way to package them so that it uses less surface area? Show your work.


Chapter 10 Project

Benford's Law: What Do Electricity Bills, House Prices, Population Numbers, Death Rates, and the Lengths of Rivers Have in Common?

Benford's law, also known as the Newcomb-Benford law, states that the first digit in real-life data is more likely to be a small number (such as 1 ) than it is to be a large number (such as 9 ). Simon Newcomb first observed the phenomenon in 1881 (with Frank Benford independently rediscovering it in 1938) after testing data from 20 different fields of study, including the surface areas of rivers, physical constants, and molecular weights. In this project, you will explore some applications of Benford's law.

Suppose we wrote each 4 -digit number on separate pieces of paper and put them in a hat. (Notice that the first digit must be 1 , 2 , 3 , 4 , 5 , 6 , 7 , 8 , or 9 while the remaining digits could also include 0 .)

  1. How many numbers in the hat start with the digit 1 ?

  2. What is the probability that a randomly selected number from the hat has 1 as its first digit?

  3. Suppose the hat contained every 12 -digit number. What would be the probability of randomly selecting a number with the first digit equal to 1 ?

Now, let's see if switching the first digit makes any difference in the probability.

  1. How many 4 -digit numbers in the hat start with the digit 9 ?

  2. What is the probability that a randomly selected number from the hat has 9 as its first digit?

  3. Suppose the hat contained every 12 -digit number. What would be the probability of randomly selecting a number with the first digit equal to 9 ?

The investigation in parts 1 through 6 illustrate what we call a uniform distribution. It seems like a reasonable thing to accept; there shouldn't be any reason why 1 would be more or less likely to occur as the first digit of a randomly generated number than 9 .

  1. Suppose you are given a list of 1000 numbers. If we assume there is a uniform distribution of numbers within the list, how many of those numbers would begin with 1 ?

Benford's law, strangely enough, states that the distribution of first digits is indeed not uniform but it follows the probabilities in the following tables.

Digit Probability of Being the First Digit
1 30.1 %
2 17.6 %
3 12.5 %
4 9.7 %
5 7.9 %
6 6.7 %
7 5.8 %
8 5.1 %
9 4.6 %
  1. Suppose that you were presented with a set of 1000 numbers. Use Benford's law to calculate how many numbers would you expect to start with 1 .

  2. Use Benford's law to calculate how many numbers would you expect to start with 9 .

  3. Compare the values found in parts 8 and 9. Explain what the values mean.

Let's test Benford's law using a few examples.

  1. Write a list of the first 30 powers of 2 . That is, write the numbers that represent 21 22 23 230 . (Hint: The use of Microsoft Excel or a calculator will help with the calculations!)

  2. How many numbers in the first 30 powers of 2 begin with the number 1 ?

  3. What is the percentage of numbers that start with the digit 1 in the first 30 powers of 2 ?

  4. What is the probability that a randomly selected power of 2 starts with the digit 1 if it is chosen from the list of the first 30 powers of 2 ? Does this result align with Benford's Law?

  5. Next, perform an internet search to find a list of counties in South Carolina with a population under 250,000 . What is the percentage of counties whose population starts with the digit 1 ? How does this compare to Benford's law?

  6. Perform an internet search to learn about different ways Benford's law can be used to detect fraud. Describe one instance where Bendford's law detected fraud.


Chapter 11 Project

Setting the Curve

Dr. Romero, a professor in the School of Computing at Klaggen University, is using a standardized final exam that is "nationally normed" for his Computer Science II class. Nationally normed implies that the normal distribution is an appropriate approximation for the probability distribution of students' scores on the exam. The probability distribution of students' scores on this standardized exam can be estimated using the normal distribution shown below.

X Axis x
A normal distribution with a mean of 78. Two values, 70 and 86, are shown with dotted lines extending to points one the curve labeled as inflection points.
  1. State the mean of the distribution of the computer science exam scores based on the figure above.

  2. State the standard deviation of the computer science exam scores based on the figure above.

At some point in our academic pursuit, we all think that we would like our professors to curve our grades. Especially if we're the ones setting the curve. After considering his students' request to curve the grades on the final exam, Dr. Romero has come up with two options to use if he decides to curve the grades.

Follow the steps listed to determine the grading scale for each option.

Curved Grading Option #1

  • Students whose raw scores are at or above the 90th percentile will receive an A.

  • Students whose raw scores are in the 80th–89th percentile will receive a B.

  • Students whose raw scores are in the 70th–79th percentile will receive a C.

  • Students whose raw scores are in the 60th–69th percentile will receive a D.

  • Students whose raw scores are below the 60th percentile will receive an F.

  1. In order to know the cutoff exam scores required for Curved Grading Option #1, Dr. Romero needs to know what z-scores correspond to the upper limit percentiles. Find each z-score that corresponds to the following percentiles. Round your z-scores to the nearest thousandth. We've found the z-score of the 90th percentile for you.

    90th percentile    1.282 00     

    80th percentile     

    70th percentile     

    60th percentile     

  2. Using the z-scores found in Step 3, find the exam scores that correspond to Curved Grading Option #1. Assume that the exam scores range from 0 to 100 . (Round to the nearest whole number.)

    Curved Grading Option #1

    A:      −      100 000     

    B:         

    C:         

    D:         

    F:       0 0000      −      

Curved Grading Option #2

The second option for curving the grades is as follows:

  • Students whose raw scores are at least two standard deviations above the mean of the standardized test will receive an A.

  • Students whose raw scores are from one up to two standard deviations above the mean of the standardized test will receive a B.

  • Students whose raw scores are from one standard deviation below the mean up to one standard deviation above the mean of the standardized test will receive a C.

  • Students whose raw scores are from two standard deviations below the mean up to one standard deviation below the mean of the standardized test will receive a D.

  • Students whose raw scores are more than two standard deviations below the mean of the standardized test will receive an F.

  1. Using the information above, find the exam scores that correspond to Curved Grading Option #2. Assume that the exam scores range from 0 to 100 . (Round to the nearest whole number.)

    Curved Grading Option #2

    A:      −      100 000     

    B:         

    C:         

    D:         

    F:       0 0000      −      

  2. Using the grading scales you just created in Steps 4 and 5, complete the following table of the partial list of grades and find the new curved letter grades that the students would receive in each of the curving options given their raw scores on the exam.

    Computer Science II Final Exam Scores
    Name Raw Score/Uncurved Grade Option #1
    Curved Grade
    Option #2
    Curved Grade
    J. Alexander 79/C
    W. Thouy 69/D
    C. Bradford 88/B
    S. Nance 66/D
    A. Moore 75/C
    K. Pinkston 86/B
    C. Navas 91/A
    R. Alexandru 77/C
    S. Garcia 82/B

After reviewing the grades for each student using the two optional curving methods, answer the following questions.

  1. Who do you think benefits the most from Curved Grading Option #1? Explain your reasoning.

  2. Who is likely to disapprove of Curved Grading Option #1? Why?

  3. Who do you think benefits the most from Curved Grading Option #2? Why?

  4. Who is likely to disapprove of Curved Grading Option #2? Why?

  5. Which grading scale do you feel is most fair? Explain why?


Chapter 12 Project

Telling a Story with Data

As you have learned throughout this chapter, data can be acquired in a variety of ways and then cleaned up, analyzed, and used to tell a story. Whether the story told about the data is true or is strongly backed by the data is something that should always be considered. While visualizations of data can help simplify the story that is being told, these visualizations can often be misleading. Consider the following data set, which shows the youth literacy rate, poverty level, access to electricity, birthrate, and mobile cellular subscriptions worldwide over a 15 -year span.

Year Youth Literacy
Rate ( % )
Poverty Level ( % ) Access to
Electricity ( % )
Birthrate
(per 1000 people)
Mobile Cellular Subscriptions
(per 100 people)
2003 87.882 24.7 80.009 20.859 22.22
2004 88.343 22.9 80.16 20.703 27.292
2005 88.475 21 80.161 20.57 33.766
2006 88.764 20.3 81.251 20.422 41.564
2007 88.667 19.1 82.205 20.341 50.263
2008 89.451 18.4 82.284 20.232 59.375
2009 89.523 17.6 82.765 20.036 67.496
2010 89.567 16 83.3 19.809 76.162
2011 89.783 13.9 82.115 19.628 83.716
2012 90.337 12.9 84.746 19.51 87.929
2013 90.674 11.4 85.031 19.298 92.461
2014 90.993 10.7 85.553 19.21 96.053
2015 91.03 10.1 86.579 18.957 97.421
2016 91.447 9.7 87.73 18.942 100.72
2017 91.629 9.3 88.617 18.621 102.869
Source: The World Bank|Data, accessed December 18, 2021, https://data.worldbank.org/.
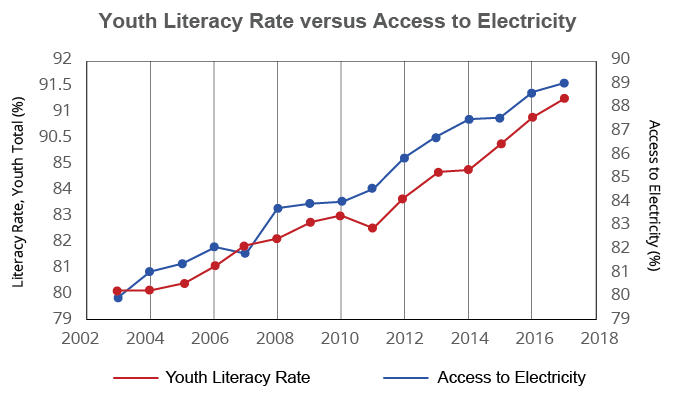
  1. Suppose the following graph was given as part of a presentation on world youth literacy rates. What does the graph seem to imply?

  2. Graph of Youth Literacy Rate versus Access to Electricity

    A graph with two y-axes using data from the table titled Youth Literacy Rate versus Access to Electricity. The x-axis is in years ranging from 2002 to 2018. One y-axis uses Youth Literacy Rate (%) data starting at 79 with a scale of 1 until 85, where the remaining values are 90.5, 91, 91.5 and 92. The second y-axis uses Access to Electricity data ranging from 79 to 91 with a uniform scale of 1.

  3. Explain how the graph might be misleading.

  4. Create a graph that shows the data graphed using the same vertical scale. Does this graph change the story that is told by the two data sets? If so, describe how. If not, explain why.

  5. Find the Pearson correlation coefficient between the youth literacy rate and access to electricity rounded to nearest ten thousandth. With a level of significance of α = 0.01 , is the relationship statistically significant?

  6. Based on your findings in part 4, if you wanted to show the relationship between youth literacy rates and access to electricity, would you use the graph from part 1 or the graph from part 3 in a presentation? Which graph tells the better story about the connection? Explain your reasoning.

  7. Calculate the Pearson correlation coefficient (rounded to the nearest ten thousandth) for the youth literacy rate compared to each of the remaining categories (that is, compared to poverty level, birthrate, and mobile cellular subscriptions). Determine which of these relationships are statistically significant at a level of significance of α = 0.01 .

  8. Using the data provided in the table, create an infographic illustrating how youth literacy rates are related to poverty level, access to electricity, birthrate, and mobile cellular subscriptions. Your infographic should contain at least 4 different elements that clearly explain the relationships between youth literacy rates and each of other categories of the data set. (Hint: Search the internet for infographics to get ideas on how to structure your infographic.)

  9. Is the infographic you created intentionally misleading in anyway? If so, explain how. Explain your reasoning for including misleading information.


Chapter 13 Project

Person of the year

It's your turn to run an election! You are going to set up and run an election to name the most influential person of the year. You will choose four well-known figures to have on your ballot, collect votes, and then name a winner.

Step 1:Develop the ballot.

  1. Choose at least four living people to place on your preference ballot for Most Influential Person of the Year. Create a preference ballot so that voters can rank each of the personalities. Be sure that the people on the ballot are well-known enough that the voters will recognize them.

  2. Who do you expect to be the winner of your election?

Step 2:Decide on how you will choose your winner.

  1. Which fairness criteria do you think is the most important in your election? Why?

  2. Based on your answer above, choose two counting methods from those covered in Chapter 13 that you will use to determine a winner: Majority Rule, Plurality, Borda Count, Plurality with Elimination, or Pairwise Comparison.

  3. Do you anticipate that both of your chosen methods will produce the same winner? Why or why not?

Step 3:Collect data.

  1. Ask at least 30 voters to rank the personalities in order of the most influential to the least. Try not to influence your voters in any way as you collect their choices. List the results in a preference table.

  2. What are some factors that might have affected the way people voted in your election?

Step 4:Analyze your results.

  1. Determine a winner using each of the methods you chose in Step 2.

Step 5:Discuss your results.

  1. Did both counting methods produce the same winner?

  2. If the counting methods you chose produced different winners, which method do you think best reflects the "will of the people"? Why?

  3. Who do you think would disapprove the most with your results? Why?

  4. What do you think would change if there were more candidates in your election? What if there were fewer candidates?


Chapter 14 Project

How Connected are You?

Merriam-Webster defines social media as "forms of electronic communication through which users create online communities to share information, ideas, personal messages, and other content." It's hard to live in the modern world and not belong to some type of social media community (such as Facebook, Snapchat, Twitter, Instagram, Pinterest… the list is long).

In this project, you will use graphs to visualize and think about your community in social media. You are going to create a graph using a social media site where both parties agree to be connected, such as Facebook or LinkedIn. A different type of graph (that is, directed graphs, which are beyond the scope of this chapter) is created when you consider one-sided connections such as "following" someone on Instagram or Twitter.

As many people often have very large communities on social media, your graph will likely be a subgraph of your entire community. Using yourself as the first vertex, you will create a graph that consists of at least 15 people as the vertices, but the more you can include, the better! If two people are connected via your social media, their vertices will be joined with an edge.

  1. Before you begin, anticipate why it is important for you to use a social media where both parties agree to be connected when constructing your graph. Describe your predictions here.

On a separate piece of paper, create graph G of your social media community. Use a minimum of 15 people to whom you are "connected" and whom are also "connected" to you. The more connections you include, the better idea you will get of your community. Begin with yourself as the first vertex. Using the person's name, label each of the vertices. If any two people are connected via your social media, their vertices should be joined with an edge. If you don't have a social media account where connections are two-way, you will need to ask a friend who has one if you can create their graph of connections and answer the questions based on their graph.

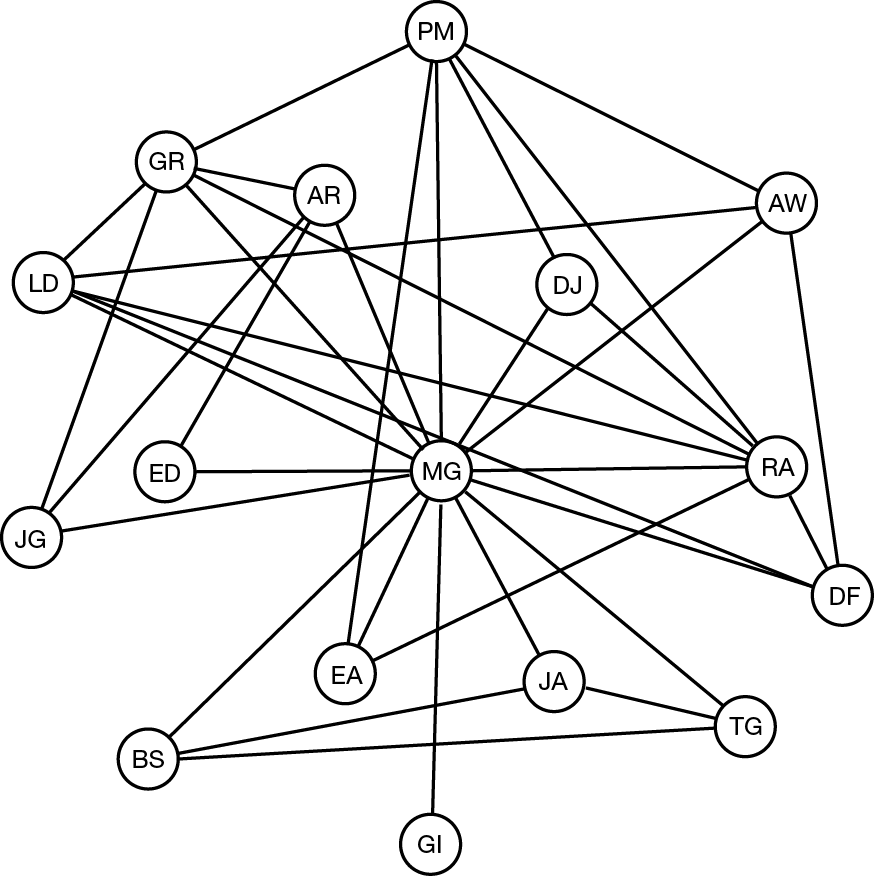
Graph of social media connections

A graph with the following nodes, listed in order by the number of connections:

  • MG is connected to AR, AW, BS, DF, DJ, EA, ED, GI, GR, JA, JG, LD, PM, RA, and TG

  • RA is connected to DF, DJ, EA, GR, LD, MG, and PM

  • GR is connected to AR, JG, LD, MG, PM, and RA

  • PM is connected to AW, DF, DJ, EA, GR, and MG

  • LD is connected to AW, DF, GR, MG, and RA

  • AR is connected to ED, GR, JG, and MG

  • AW is connected to DF, LD, MG, and PM

  • DF is connected to AW, LD, MG, and RA

  • BS is connected to JA, MG, and TG

  • DJ is connected to MG, PM, and RA

  • EA is connected to MG, PM, and RA

  • JA is connected to BS, MG, and TG

  • JG is connected to AR, GR, and MG

  • TG is connected to BS, JA, and MG

  • ED is connected to AR and MG

  • GI is connected to MG

Answer the following questions about your graph G.

  1. What was the most difficult part of constructing G?

  2. How many vertices does G have?

  3. How many edges does G have?

  4. Is G connected? Why or why not?

  5. Is G connected if you remove your vertex from the graph?

  6. Suppose G becomes a disconnected graph upon removing your vertex, what does that mean in social terms about your groups of connections?

Now create a new graph on a separate piece of paper in which you remove your vertex from the graph G. Use this new graph F to answer the following questions.

  1. What can you say about the neighborhoods of the vertices in F?

  2. Which vertex in F has the largest degree? What is its degree?

  3. What can you say in terms of social media about the person with the largest vertex degree in F?

  4. Find the largest complete subgraph in F.

  5. What does this subgraph represent in terms of social media?

  6. Find the chromatic number χ of F.

  7. Find a vertex coloring of F with χ colors.

  8. What can you say about a group of people in F whose vertices all have the same color in your coloring?

  9. What would it mean in terms of the social media if F has a high chromatic number?

  10. What would it mean in terms of the social media if F has a low chromatic number?

  11. Find a minimum vertex cover of F.

  12. Why might a minimum vertex cover be useful to know if friends of yours were using social media to organize a surprise party for you?

  13. Find a spanning tree of F or, if F is not connected, find a spanning tree of the largest connected subgraph of F.

  14. How long is the longest path in your spanning tree?

  15. What does the longest path represent in terms of your social media connections?

  16. How many leaves are on your spanning tree?

  17. Does the number of leaves on your spanning tree indicate how many social media connections you have? Why or why not?

Consider the bipartite graph H formed by your social media connections on one side and the months of the year on the other side. A person is joined to their birthday month with an edge.

  1. When would this bipartite graph H have a matching from the months of the year into the people?

  2. When would H have a matching from the people into the months?

  3. Finally, think about what each of the graphs G, F, and H say about you and social media. Describe at least one practical way that you could use the information you've discovered in one of the the three graphs.