IS THAT NORMAL?
In Section 11.4, you learned how to use a normal distribution to calculate z-scores and answer questions about probability. We found that variables such as height, body temperature, weight, and blood pressure are common examples of data that are normally distributed. Because of the relative ease of calculating probabilities using normal distributions, it's tempting to assume, when collecting and analyzing data, that the variable or characteristic in question has a normal distribution. However, if the data set doesn't have a normal distribution, any conclusions we draw using standard scores is suspect at best. Fortunately, there is a method available to check the data beforehand and determine whether the population from which the data are taken has a normal distribution. It is called a normality test.
Normality Test
Step 1:
Sort the data values so they are arranged from smallest to largest, and assign a rank to each value with 1 corresponding to the smallest value and n corresponding to the largest value, where n is equal to the sample size.
Step 2:
Once sorted, compute the percentile occupied by each value using the formula
,
where k is the rank.
Step 3:
Using the percentile computed in the previous step, find the corresponding z-score for each value.
Step 4:
Graph the points of the observed values from the data set on the horizontal axis and the corresponding expected z-scores from Step 3 on the vertical axis. This is called a normal probability plot.
Step 5:
If the plot has a linear pattern, we can conclude the data values were drawn from a normal distribution. If the plot shows no pattern or some other trend rather than linear, we can conclude the data are not drawn from a normal distribution.
Note: The data should have no more than one outlier, an extremely large or extremely small value not typical of the other values in the data set. If there are two or more outliers, it is unlikely the data are drawn from a normal distribution.
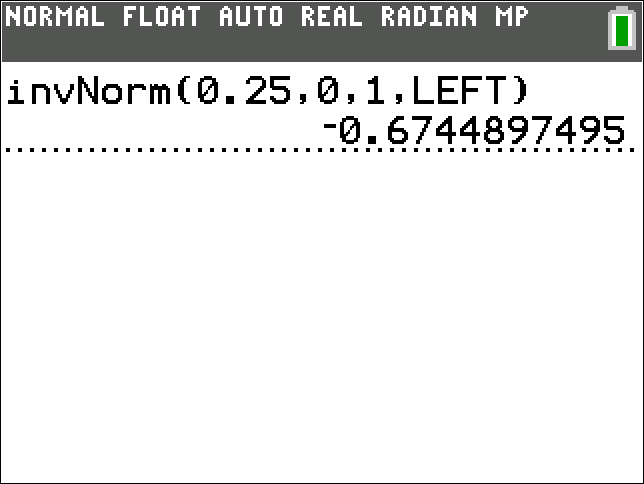
The Normality Test is straightforward except for Step 3. To find z-scores from percentiles, you are essentially "working backwards" and will need appropriate technology to obtain them. For example, these are the steps when finding the corresponding z-score for the 25th percentile () using a TI-83/84 Plus calculator.
Step 1:
Choose DISTR by pressing 2nd then vars.
Step 2:
Select invNorm(.
Step 3:
Press enter.
Step 4:
Input the area to the left of z (that is, the 25th percentile in decimal form), .
Step 5:
Press enter five times.
Step 6:
The z-score will be displayed. To two decimal places, it is −0.67 (Note that the negative sign indicates the z-score is in the lower half of the standard normal distribution and lies to the left of the standard mean of zero.)
If technology is not readily available, the z-scores corresponding to the percentiles in a data set of sample size are provided in the following table.
| Rank | Percentile | z-score |
|---|---|---|
Let's now test a data set to see if we can conclude that the population from which it is taken is normally distributed.
-
Randomly select classmates and record their heart rate in beats per minute (bpm). You can count the rate for seconds and multiple by four to save time, or you can count for the entire seconds. The counting method is your choice.
-
Carry out Steps 1 through 4 in the Normality Test. If some heart rates appear more than once, each heart rate will still get its own distinct ranking. For example, if the three lowest rates are all , then followed by , the rankings would be , and so on. Are there any outliers in your data set? If so, identify them.
-
Does your graph follow closely enough to a linear pattern for you to conclude the population from which it is drawn is normally distributed? If not, what might be some reasons why? What is the population? What is your conclusion about the distribution of heart rates in the population?
-
If time permits, repeat the test with another randomly selected classmates and compare results.
-
If time permits and you have access to technology to calculate the z-score for any given percentile, choose a population of your own that you wish to test for normality and randomly select a sample of arbitrary sample size to conduct your test. Brainstorm with your project team members and instructor to come up with ideas.